| __timestamp | Cisco Systems, Inc. | Pure Storage, Inc. |
|---|---|---|
| Wednesday, January 1, 2014 | 11437000000 | 60652000 |
| Thursday, January 1, 2015 | 11861000000 | 184674000 |
| Friday, January 1, 2016 | 11433000000 | 315976000 |
| Sunday, January 1, 2017 | 11177000000 | 444687000 |
| Monday, January 1, 2018 | 11386000000 | 575200000 |
| Tuesday, January 1, 2019 | 11398000000 | 721617000 |
| Wednesday, January 1, 2020 | 11094000000 | 891175000 |
| Friday, January 1, 2021 | 11411000000 | 898491000 |
| Saturday, January 1, 2022 | 11186000000 | 988982000 |
| Sunday, January 1, 2023 | 12358000000 | 1121605000 |
| Monday, January 1, 2024 | 13177000000 | 1197264000 |
Igniting the spark of knowledge
In the ever-evolving tech landscape, understanding operational efficiency is crucial. Cisco Systems, Inc. and Pure Storage, Inc. offer a fascinating study in contrasts. From 2014 to 2024, Cisco's Selling, General, and Administrative (SG&A) expenses have shown a steady increase, peaking at approximately $13.2 billion in 2024. This represents a 15% rise from 2014, reflecting Cisco's expansive operational strategies.
Conversely, Pure Storage, Inc., a younger player, has seen its SG&A expenses grow from a modest $60 million in 2014 to nearly $1.2 billion in 2024, marking an exponential increase of over 1,800%. This surge underscores Pure Storage's aggressive market penetration and scaling efforts.
While Cisco's expenses highlight its established market presence, Pure Storage's rapid growth trajectory signals its ambition to disrupt the industry. This comparison offers valuable insights into how different strategies impact financial efficiency in the tech sector.
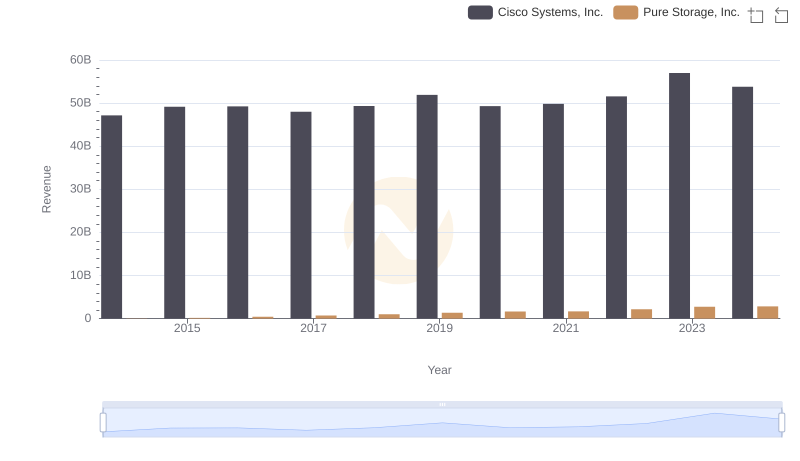
Breaking Down Revenue Trends: Cisco Systems, Inc. vs Pure Storage, Inc.
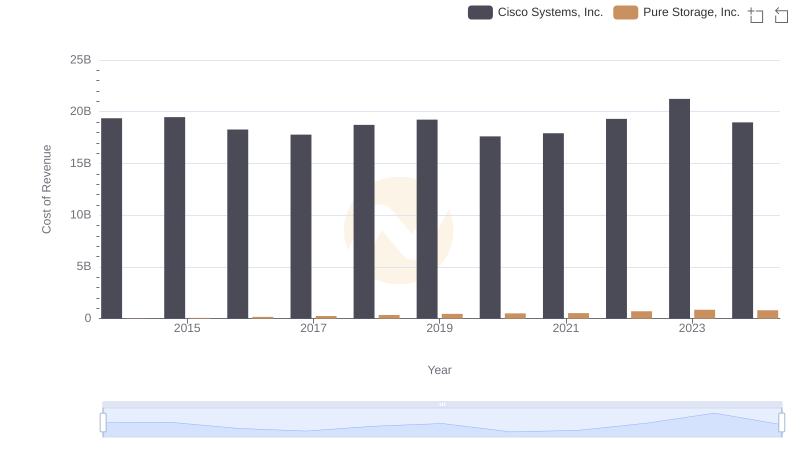
Cost of Revenue: Key Insights for Cisco Systems, Inc. and Pure Storage, Inc.
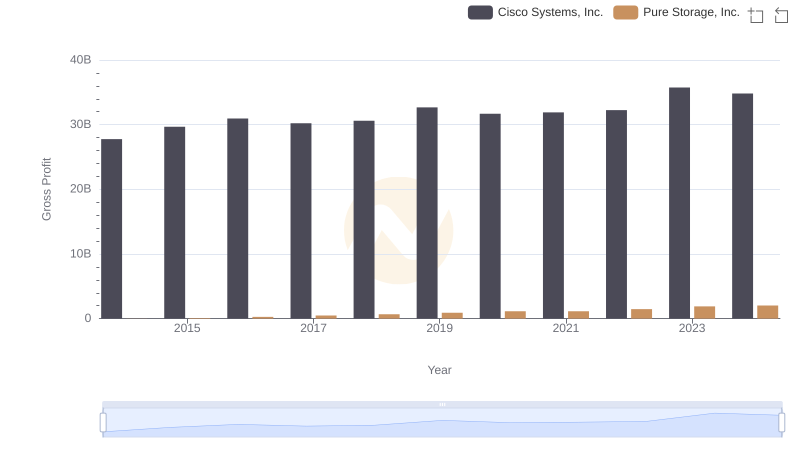
Gross Profit Comparison: Cisco Systems, Inc. and Pure Storage, Inc. Trends
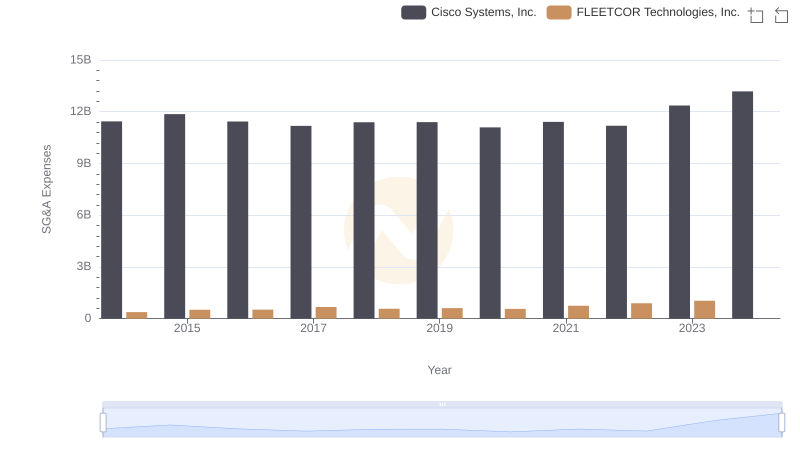
Cisco Systems, Inc. vs FLEETCOR Technologies, Inc.: SG&A Expense Trends
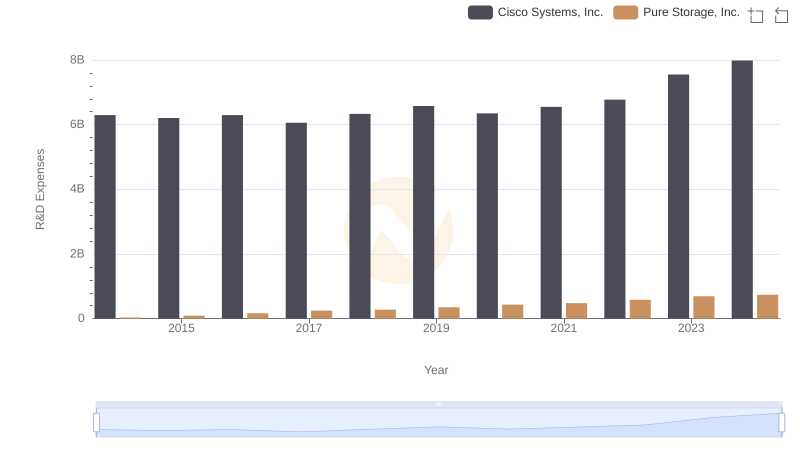
Research and Development Expenses Breakdown: Cisco Systems, Inc. vs Pure Storage, Inc.
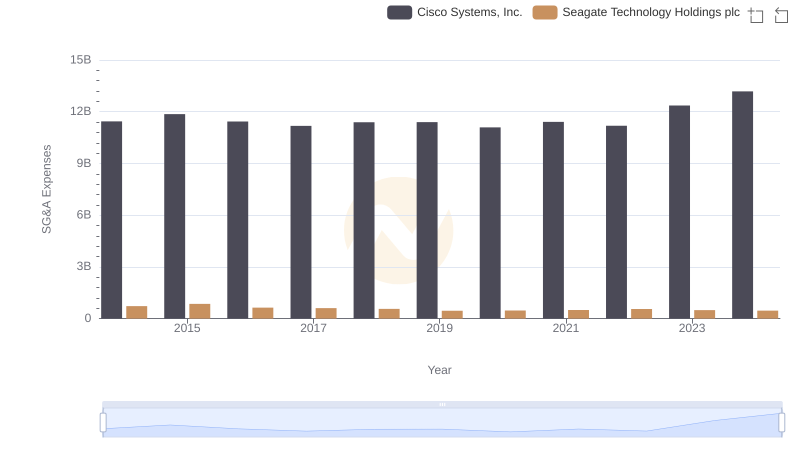
SG&A Efficiency Analysis: Comparing Cisco Systems, Inc. and Seagate Technology Holdings plc
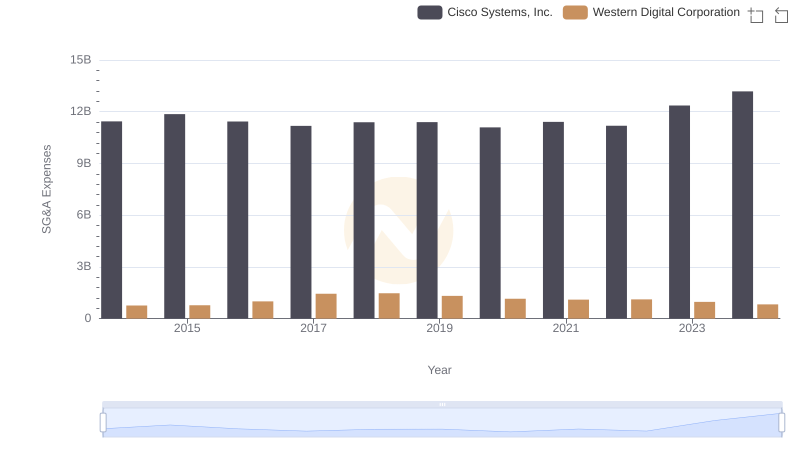
Breaking Down SG&A Expenses: Cisco Systems, Inc. vs Western Digital Corporation
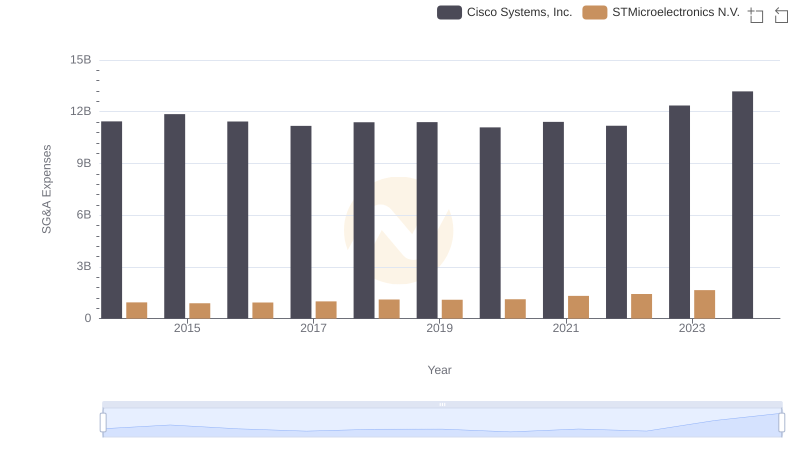
Operational Costs Compared: SG&A Analysis of Cisco Systems, Inc. and STMicroelectronics N.V.
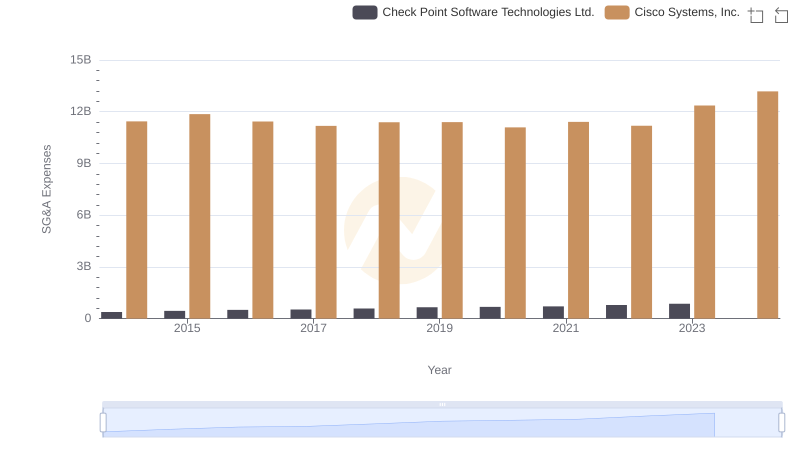
Cisco Systems, Inc. vs Check Point Software Technologies Ltd.: SG&A Expense Trends
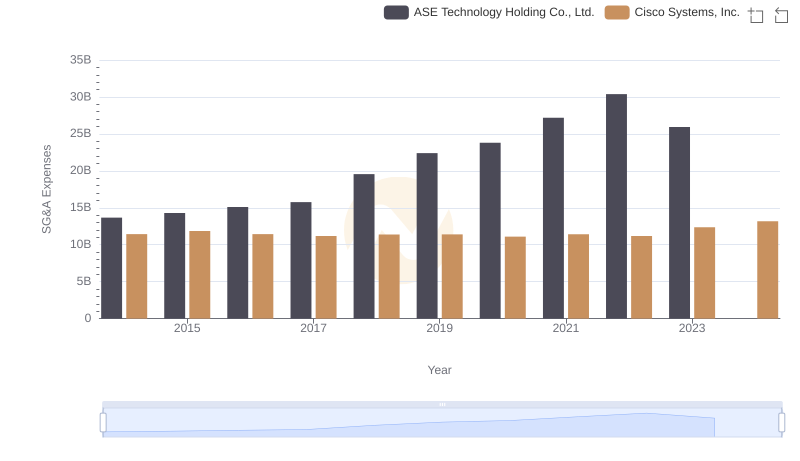
Cost Management Insights: SG&A Expenses for Cisco Systems, Inc. and ASE Technology Holding Co., Ltd.
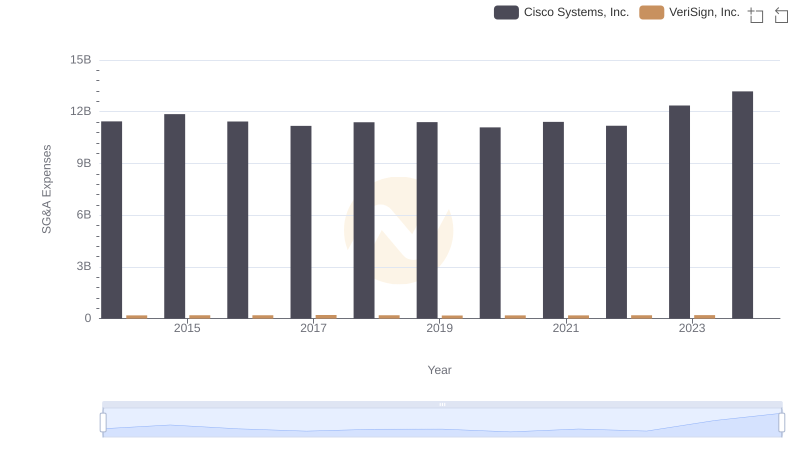
Cisco Systems, Inc. vs VeriSign, Inc.: SG&A Expense Trends

SG&A Efficiency Analysis: Comparing Cisco Systems, Inc. and Zebra Technologies Corporation