| __timestamp | ASE Technology Holding Co., Ltd. | Cisco Systems, Inc. |
|---|---|---|
| Wednesday, January 1, 2014 | 53540000000 | 27769000000 |
| Thursday, January 1, 2015 | 50149000000 | 29681000000 |
| Friday, January 1, 2016 | 53194000000 | 30960000000 |
| Sunday, January 1, 2017 | 52732000000 | 30224000000 |
| Monday, January 1, 2018 | 61163000000 | 30606000000 |
| Tuesday, January 1, 2019 | 64311000000 | 32666000000 |
| Wednesday, January 1, 2020 | 77984000000 | 31683000000 |
| Friday, January 1, 2021 | 110369000000 | 31894000000 |
| Saturday, January 1, 2022 | 134930000000 | 32248000000 |
| Sunday, January 1, 2023 | 91757132000 | 35753000000 |
| Monday, January 1, 2024 | 95687183000 | 34828000000 |
Cracking the code
In the ever-evolving tech landscape, Cisco Systems, Inc. and ASE Technology Holding Co., Ltd. have emerged as titans in their respective domains. Over the past decade, ASE Technology has consistently outperformed Cisco in terms of gross profit, with a staggering 80% increase from 2014 to 2022. In contrast, Cisco's growth has been more modest, with a 15% rise over the same period. Notably, 2022 marked a peak for ASE Technology, achieving a gross profit nearly four times that of Cisco. However, 2023 saw a dip for ASE, while Cisco continued its upward trajectory, closing the gap. This dynamic shift highlights the volatile nature of the tech industry, where market demands and innovations can rapidly alter financial landscapes. As we look to the future, the missing data for 2024 leaves room for speculation and anticipation.
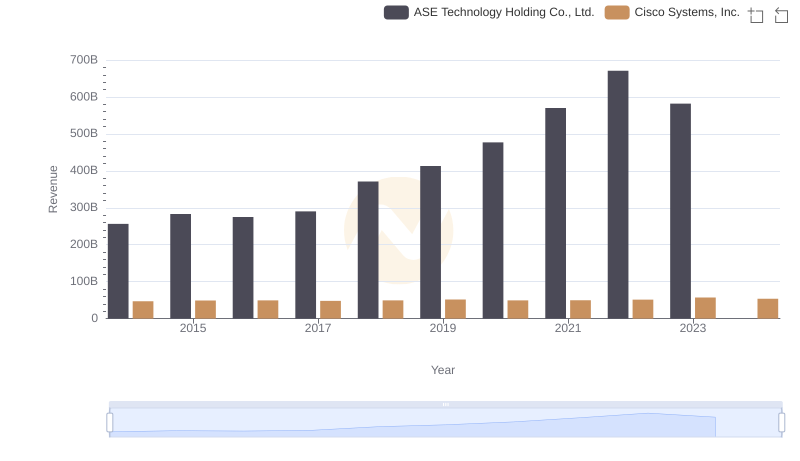
Cisco Systems, Inc. and ASE Technology Holding Co., Ltd.: A Comprehensive Revenue Analysis
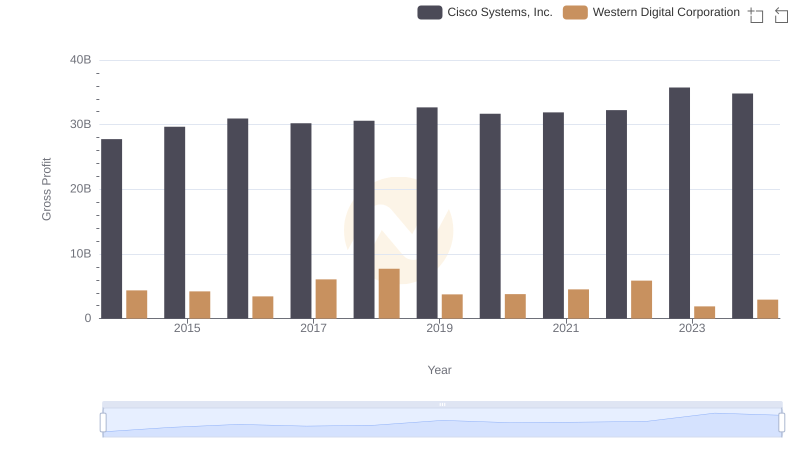
Cisco Systems, Inc. and Western Digital Corporation: A Detailed Gross Profit Analysis
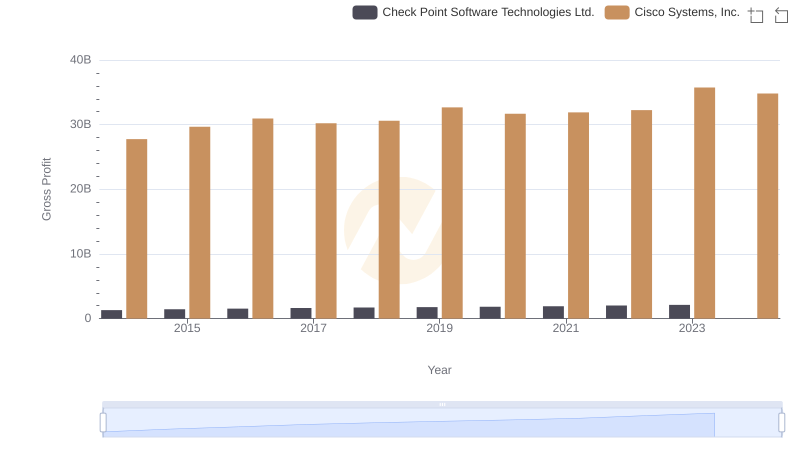
Key Insights on Gross Profit: Cisco Systems, Inc. vs Check Point Software Technologies Ltd.
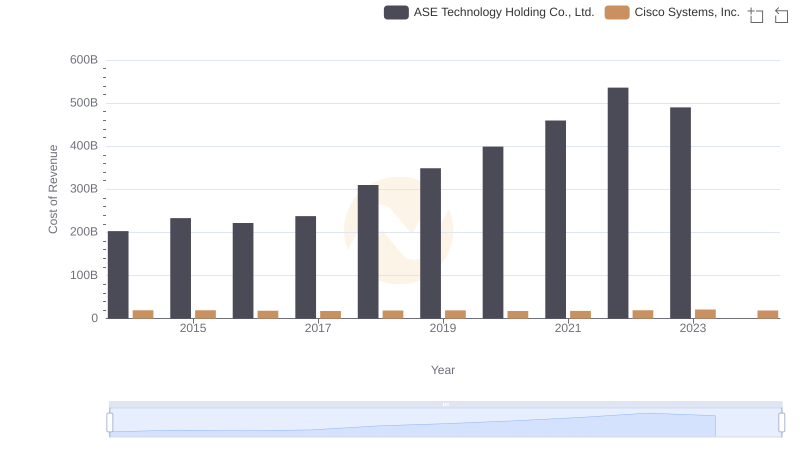
Analyzing Cost of Revenue: Cisco Systems, Inc. and ASE Technology Holding Co., Ltd.
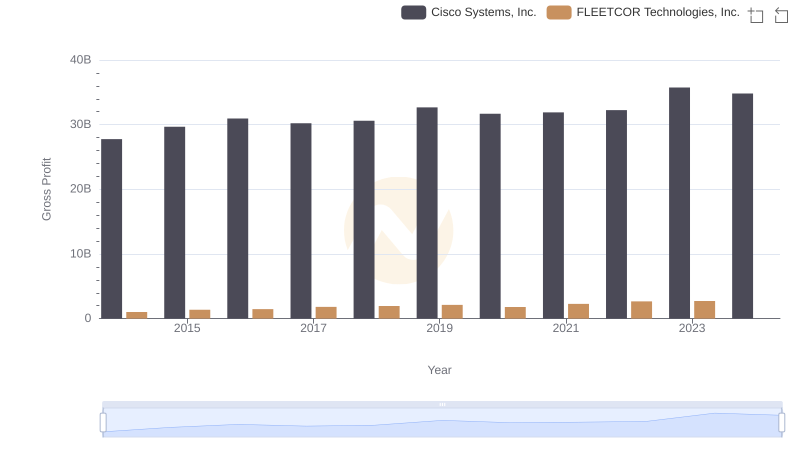
Gross Profit Analysis: Comparing Cisco Systems, Inc. and FLEETCOR Technologies, Inc.
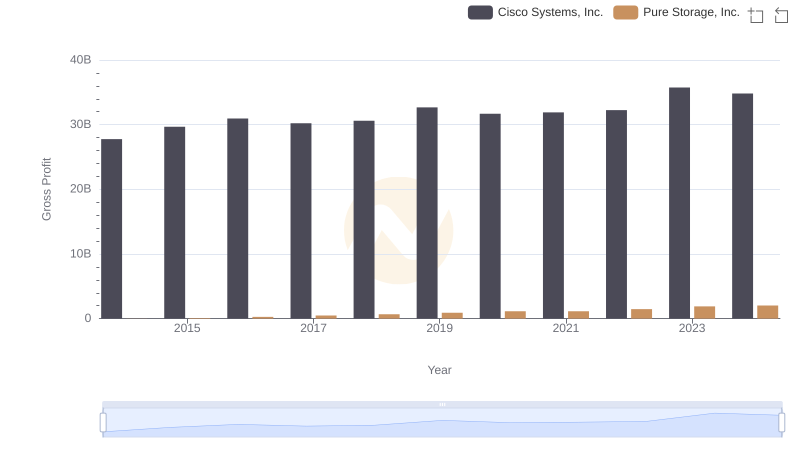
Gross Profit Comparison: Cisco Systems, Inc. and Pure Storage, Inc. Trends
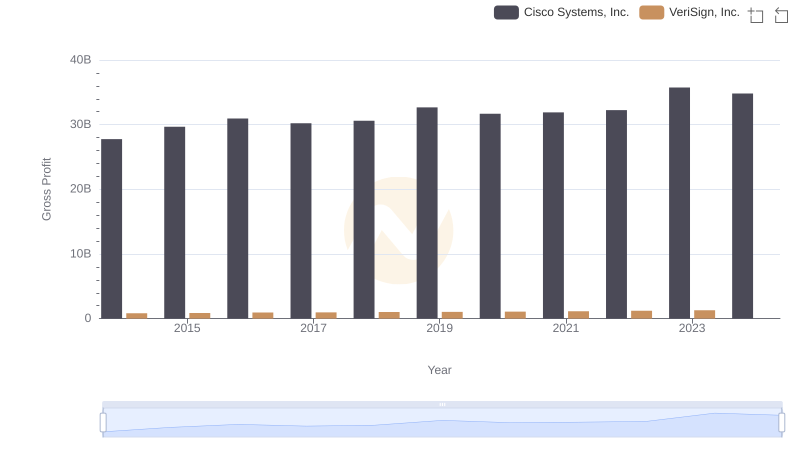
Cisco Systems, Inc. vs VeriSign, Inc.: A Gross Profit Performance Breakdown
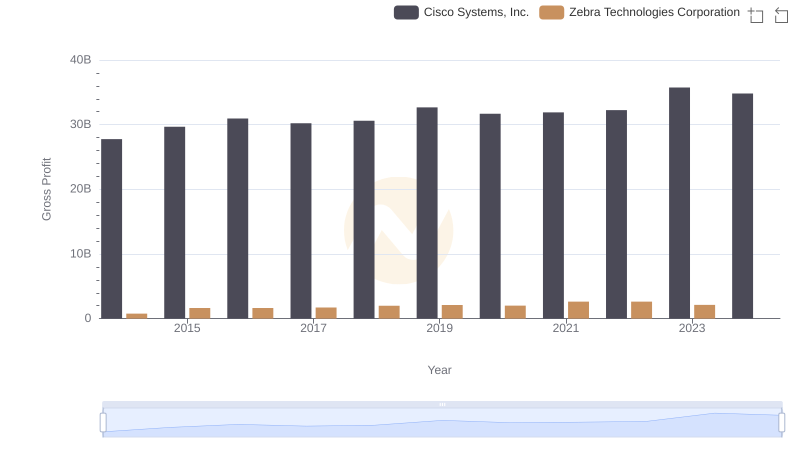
Key Insights on Gross Profit: Cisco Systems, Inc. vs Zebra Technologies Corporation
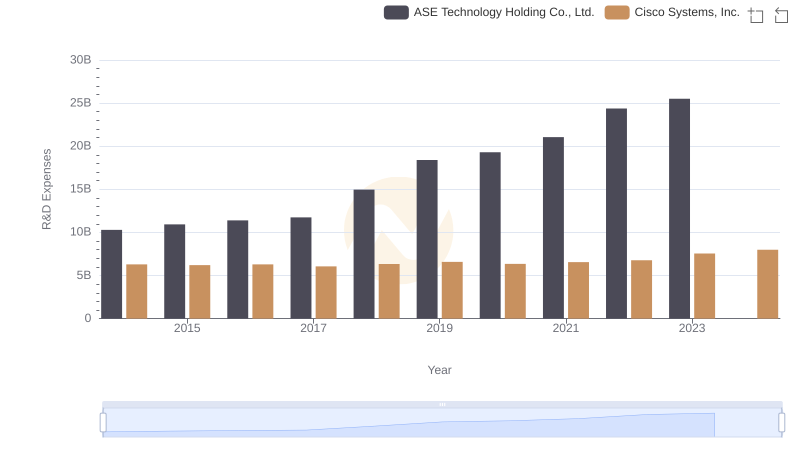
Cisco Systems, Inc. vs ASE Technology Holding Co., Ltd.: Strategic Focus on R&D Spending
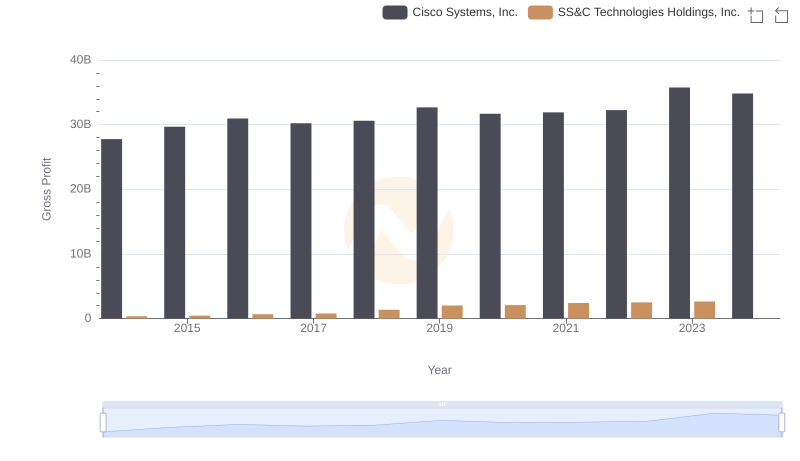
Gross Profit Trends Compared: Cisco Systems, Inc. vs SS&C Technologies Holdings, Inc.
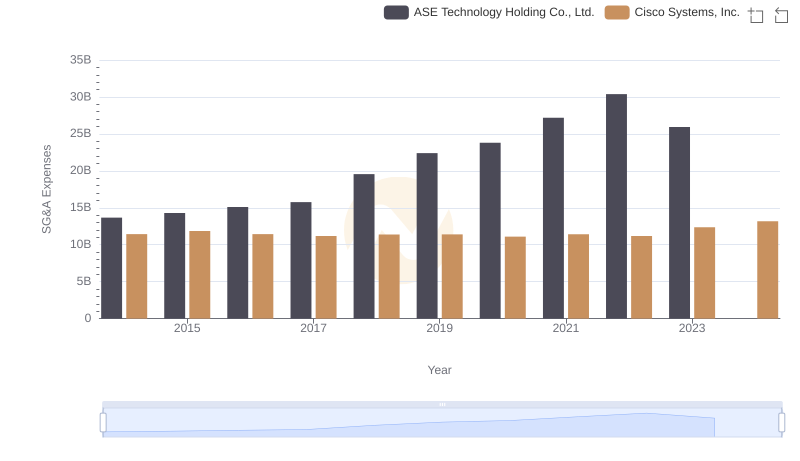
Cost Management Insights: SG&A Expenses for Cisco Systems, Inc. and ASE Technology Holding Co., Ltd.
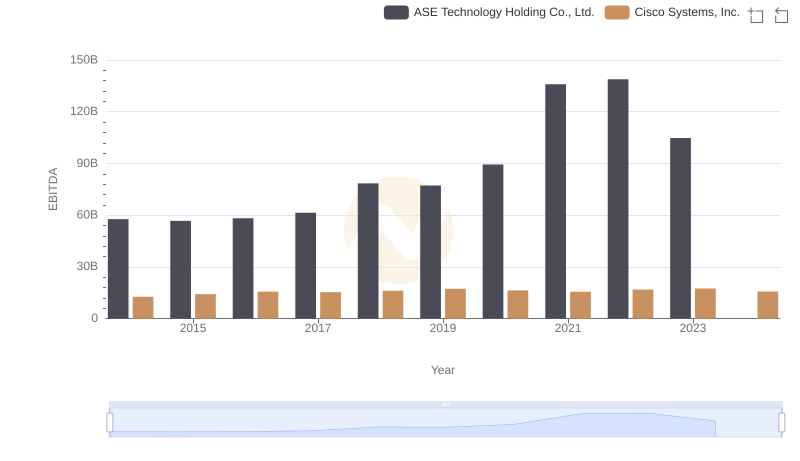
EBITDA Analysis: Evaluating Cisco Systems, Inc. Against ASE Technology Holding Co., Ltd.