| __timestamp | Cisco Systems, Inc. | VeriSign, Inc. |
|---|---|---|
| Wednesday, January 1, 2014 | 11437000000 | 189488000 |
| Thursday, January 1, 2015 | 11861000000 | 196914000 |
| Friday, January 1, 2016 | 11433000000 | 198253000 |
| Sunday, January 1, 2017 | 11177000000 | 211705000 |
| Monday, January 1, 2018 | 11386000000 | 197559000 |
| Tuesday, January 1, 2019 | 11398000000 | 184262000 |
| Wednesday, January 1, 2020 | 11094000000 | 186003000 |
| Friday, January 1, 2021 | 11411000000 | 188311000 |
| Saturday, January 1, 2022 | 11186000000 | 195400000 |
| Sunday, January 1, 2023 | 12358000000 | 204200000 |
| Monday, January 1, 2024 | 13177000000 | 211100000 |
Cracking the code
In the ever-evolving tech industry, understanding financial trends is crucial. Over the past decade, Cisco Systems, Inc. and VeriSign, Inc. have shown distinct patterns in their Selling, General, and Administrative (SG&A) expenses. Cisco's SG&A expenses have seen a steady increase, peaking in 2024 with a 15% rise from 2014. This growth reflects Cisco's strategic investments in innovation and market expansion. In contrast, VeriSign's SG&A expenses have remained relatively stable, with a slight increase of about 8% from 2014 to 2023, indicating a focus on maintaining operational efficiency. Notably, data for VeriSign in 2024 is unavailable, suggesting a potential shift or anomaly in reporting. These trends highlight the differing strategies of these tech giants, with Cisco aggressively expanding and VeriSign maintaining a steady course. As the tech landscape continues to shift, these financial insights provide a window into the strategic priorities of these industry leaders.
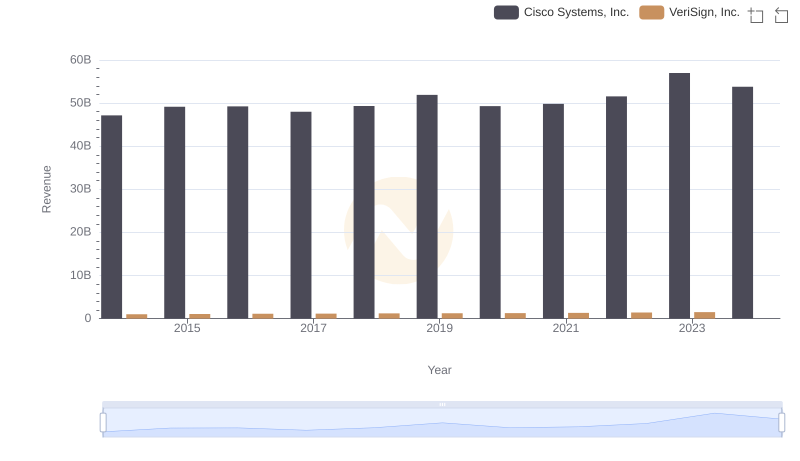
Comparing Revenue Performance: Cisco Systems, Inc. or VeriSign, Inc.?
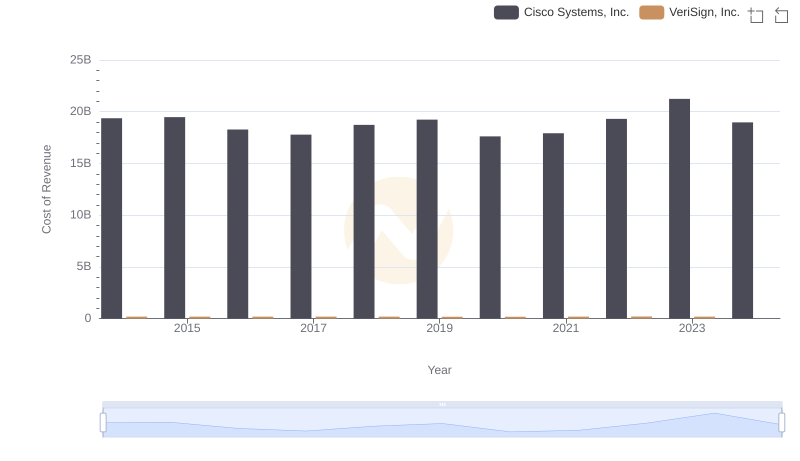
Cost of Revenue: Key Insights for Cisco Systems, Inc. and VeriSign, Inc.
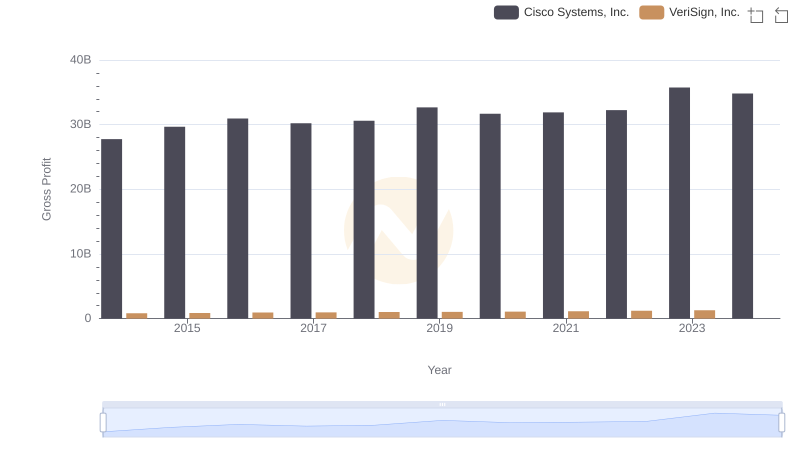
Cisco Systems, Inc. vs VeriSign, Inc.: A Gross Profit Performance Breakdown
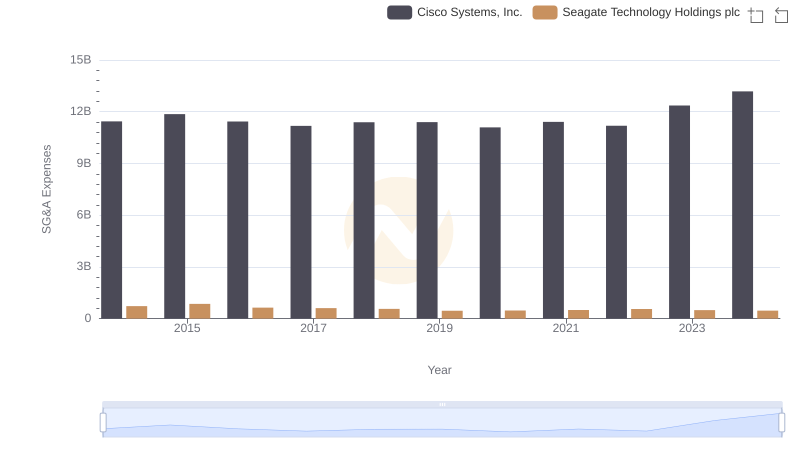
SG&A Efficiency Analysis: Comparing Cisco Systems, Inc. and Seagate Technology Holdings plc
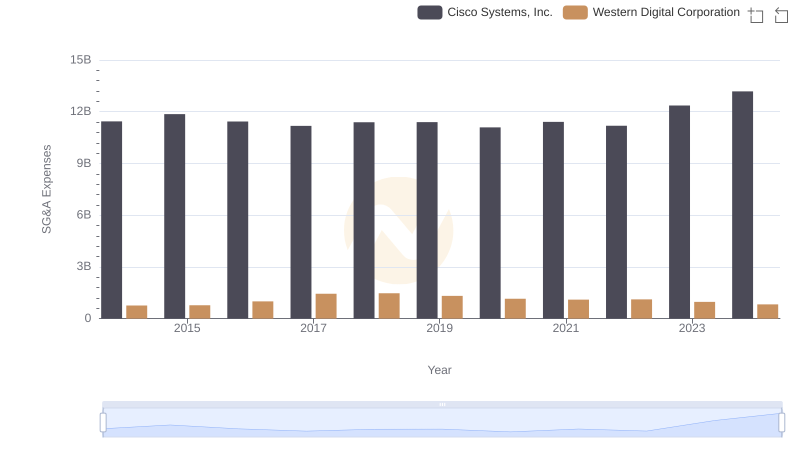
Breaking Down SG&A Expenses: Cisco Systems, Inc. vs Western Digital Corporation
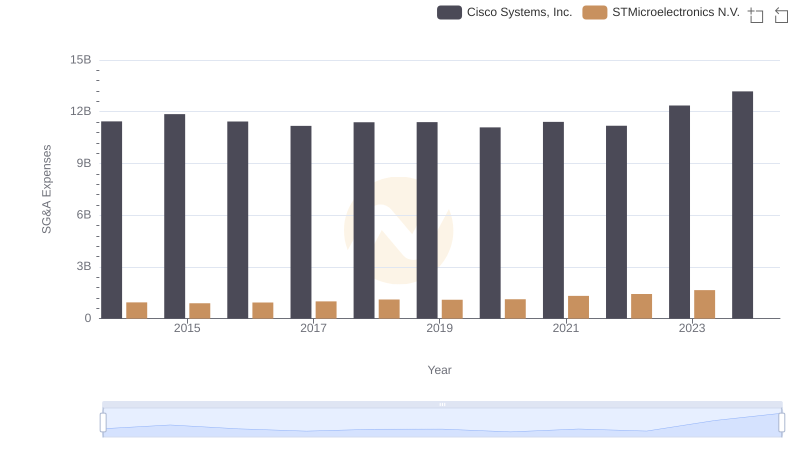
Operational Costs Compared: SG&A Analysis of Cisco Systems, Inc. and STMicroelectronics N.V.
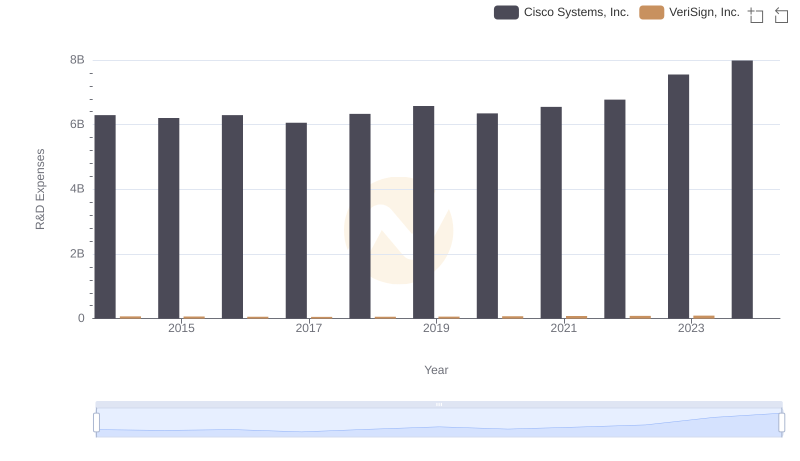
R&D Insights: How Cisco Systems, Inc. and VeriSign, Inc. Allocate Funds
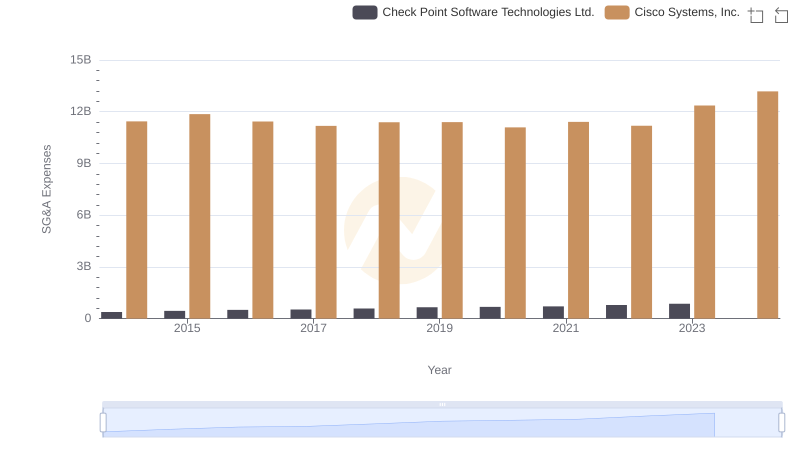
Cisco Systems, Inc. vs Check Point Software Technologies Ltd.: SG&A Expense Trends
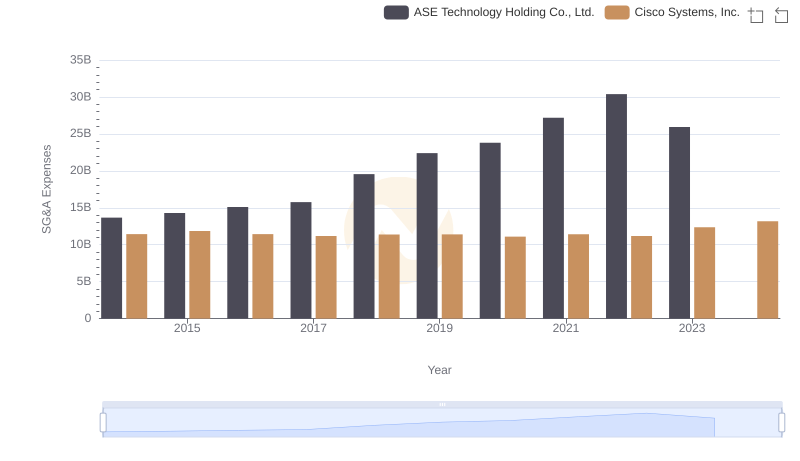
Cost Management Insights: SG&A Expenses for Cisco Systems, Inc. and ASE Technology Holding Co., Ltd.
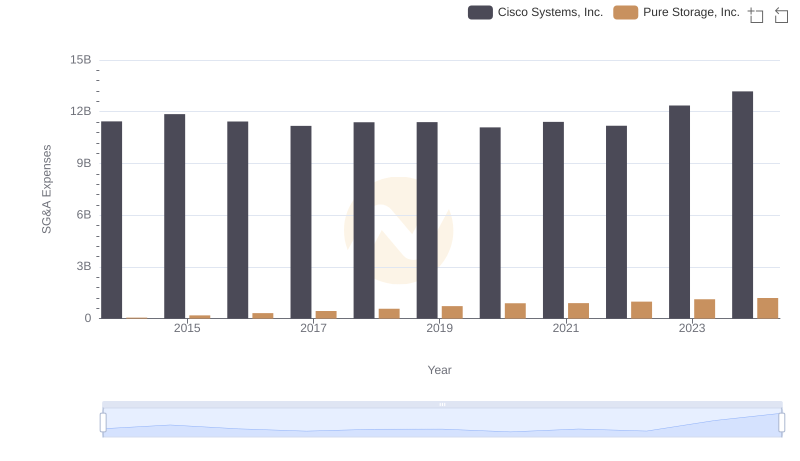
SG&A Efficiency Analysis: Comparing Cisco Systems, Inc. and Pure Storage, Inc.
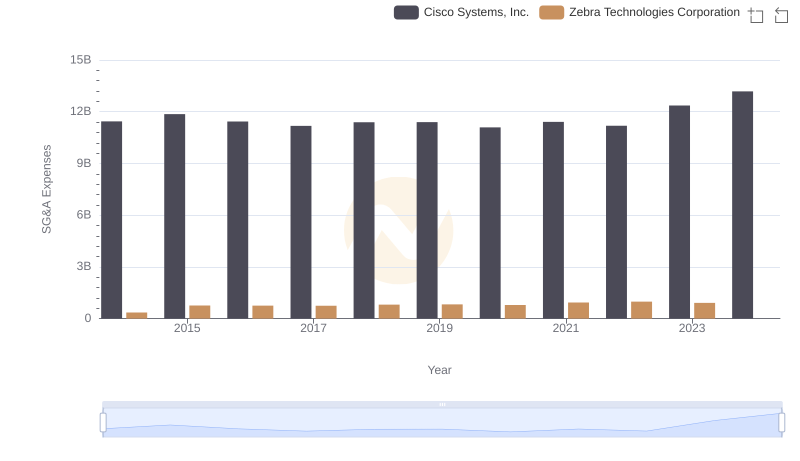
SG&A Efficiency Analysis: Comparing Cisco Systems, Inc. and Zebra Technologies Corporation
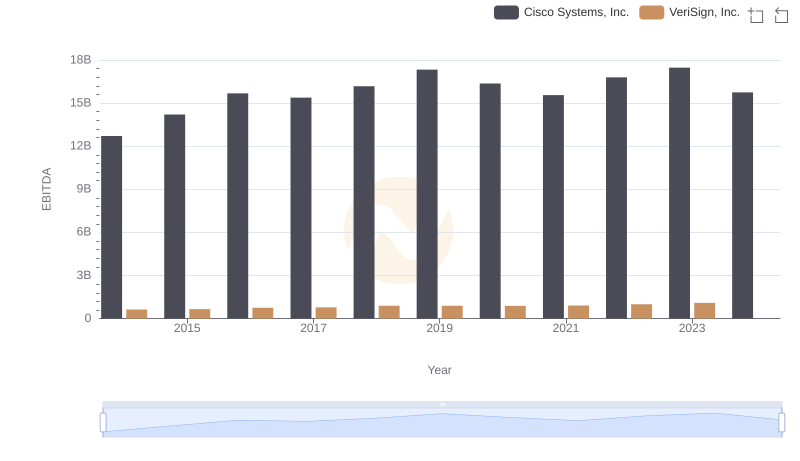
EBITDA Metrics Evaluated: Cisco Systems, Inc. vs VeriSign, Inc.