| __timestamp | Cisco Systems, Inc. | Seagate Technology Holdings plc |
|---|---|---|
| Wednesday, January 1, 2014 | 11437000000 | 722000000 |
| Thursday, January 1, 2015 | 11861000000 | 857000000 |
| Friday, January 1, 2016 | 11433000000 | 635000000 |
| Sunday, January 1, 2017 | 11177000000 | 606000000 |
| Monday, January 1, 2018 | 11386000000 | 562000000 |
| Tuesday, January 1, 2019 | 11398000000 | 453000000 |
| Wednesday, January 1, 2020 | 11094000000 | 473000000 |
| Friday, January 1, 2021 | 11411000000 | 502000000 |
| Saturday, January 1, 2022 | 11186000000 | 559000000 |
| Sunday, January 1, 2023 | 12358000000 | 491000000 |
| Monday, January 1, 2024 | 13177000000 | 460000000 |
In pursuit of knowledge
In the ever-evolving tech landscape, understanding operational efficiency is crucial. Cisco Systems, Inc. and Seagate Technology Holdings plc, two titans in their respective fields, offer a fascinating study in SG&A (Selling, General, and Administrative) expenses over the past decade.
From 2014 to 2024, Cisco's SG&A expenses have shown a consistent upward trend, peaking at approximately $13.2 billion in 2024. This represents a 15% increase from 2014, reflecting Cisco's strategic investments in sales and administration to maintain its competitive edge.
Conversely, Seagate's SG&A expenses have decreased by about 36% over the same period, dropping to around $460 million in 2024. This reduction highlights Seagate's focus on cost efficiency and streamlined operations amidst a challenging market environment.
These contrasting strategies underscore the diverse approaches companies take to balance growth and efficiency, offering valuable insights for investors and industry analysts alike.
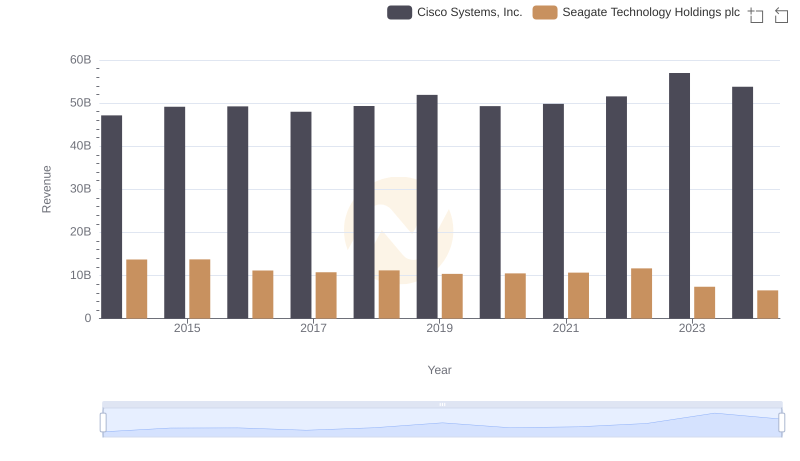
Cisco Systems, Inc. vs Seagate Technology Holdings plc: Examining Key Revenue Metrics
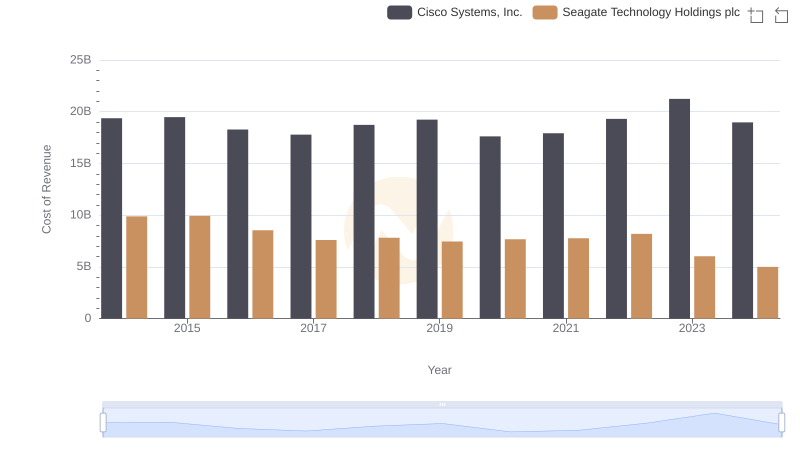
Analyzing Cost of Revenue: Cisco Systems, Inc. and Seagate Technology Holdings plc
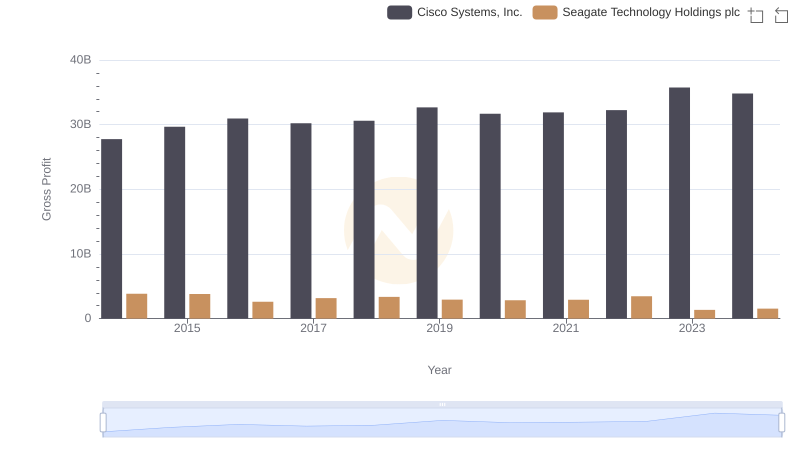
Who Generates Higher Gross Profit? Cisco Systems, Inc. or Seagate Technology Holdings plc
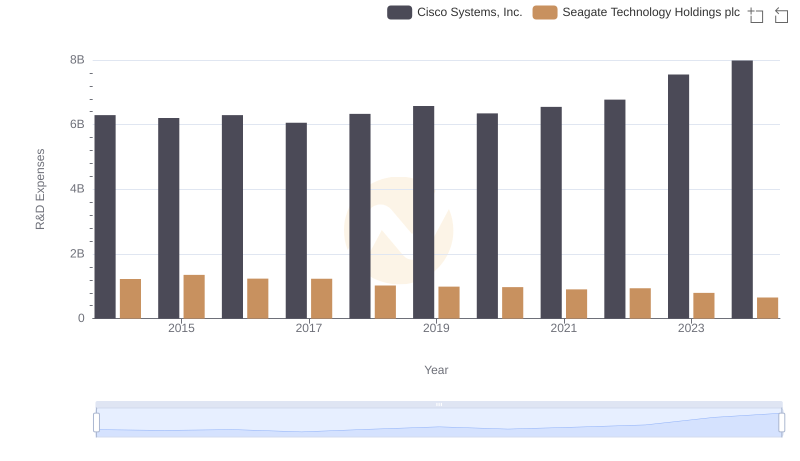
Who Prioritizes Innovation? R&D Spending Compared for Cisco Systems, Inc. and Seagate Technology Holdings plc
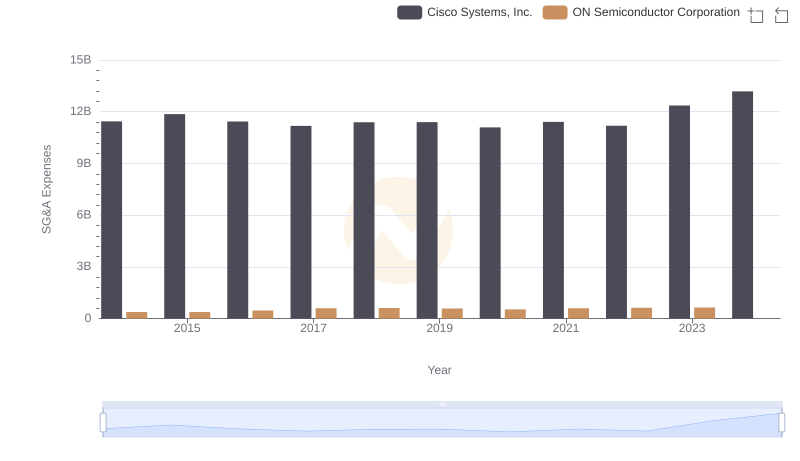
Selling, General, and Administrative Costs: Cisco Systems, Inc. vs ON Semiconductor Corporation
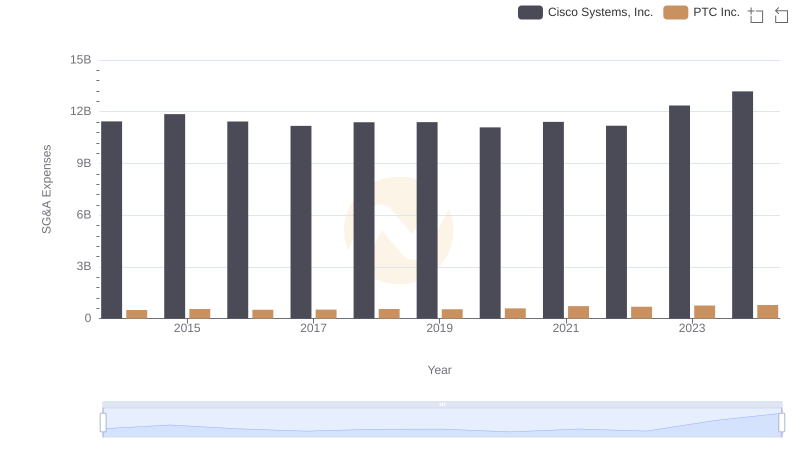
Cisco Systems, Inc. vs PTC Inc.: SG&A Expense Trends

Cisco Systems, Inc. vs FLEETCOR Technologies, Inc.: SG&A Expense Trends
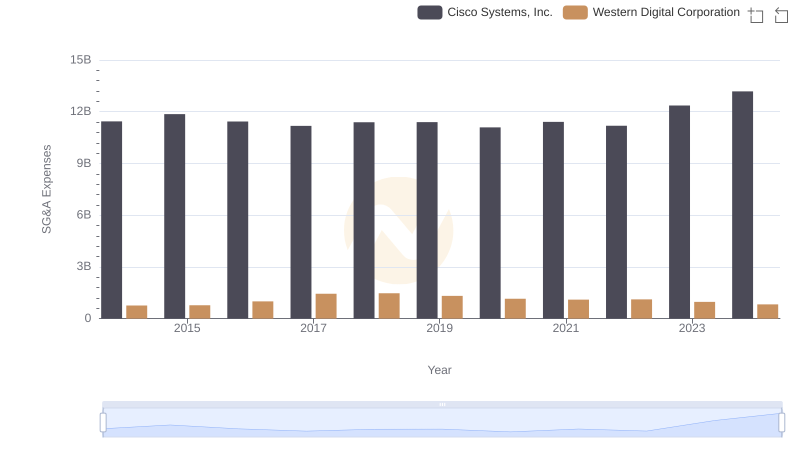
Breaking Down SG&A Expenses: Cisco Systems, Inc. vs Western Digital Corporation
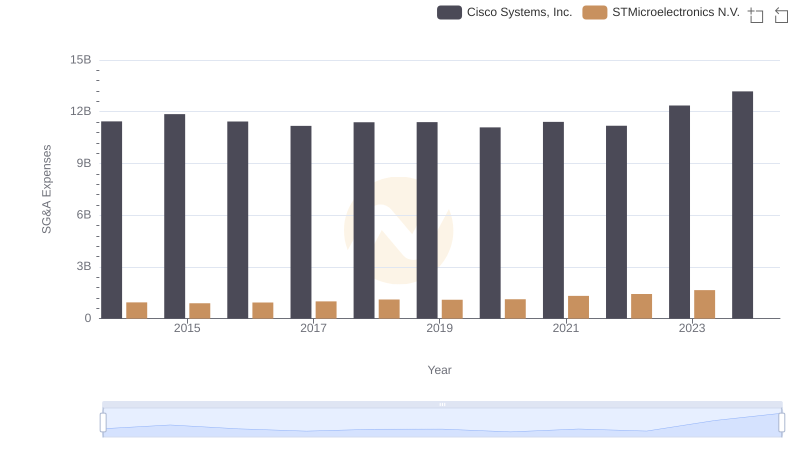
Operational Costs Compared: SG&A Analysis of Cisco Systems, Inc. and STMicroelectronics N.V.
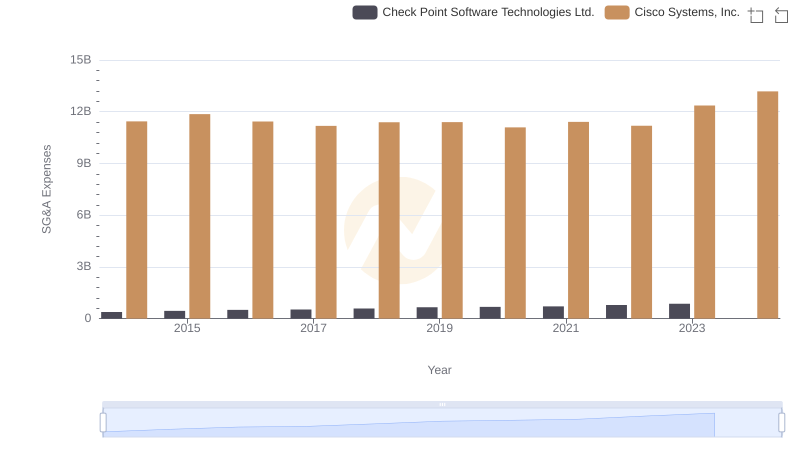
Cisco Systems, Inc. vs Check Point Software Technologies Ltd.: SG&A Expense Trends
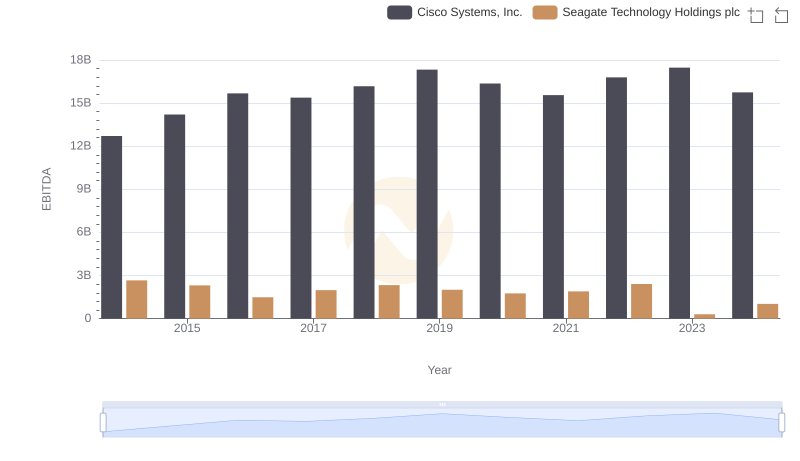
Cisco Systems, Inc. and Seagate Technology Holdings plc: A Detailed Examination of EBITDA Performance
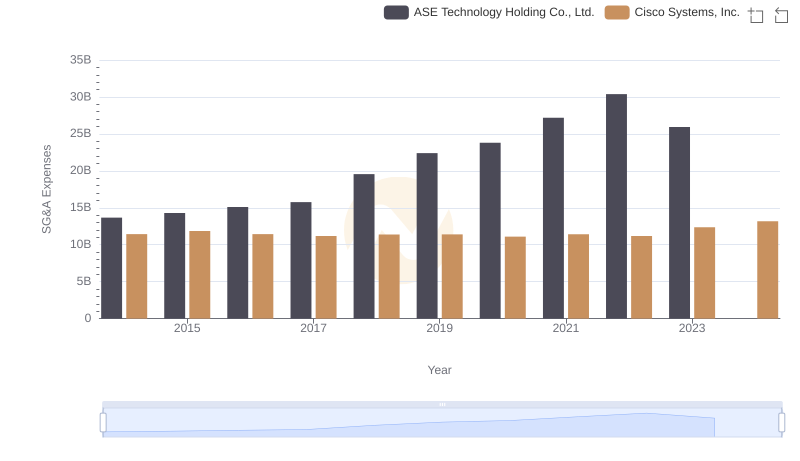
Cost Management Insights: SG&A Expenses for Cisco Systems, Inc. and ASE Technology Holding Co., Ltd.