| __timestamp | ASE Technology Holding Co., Ltd. | Cisco Systems, Inc. |
|---|---|---|
| Wednesday, January 1, 2014 | 203051000000 | 19373000000 |
| Thursday, January 1, 2015 | 233153000000 | 19480000000 |
| Friday, January 1, 2016 | 221690000000 | 18287000000 |
| Sunday, January 1, 2017 | 237709000000 | 17781000000 |
| Monday, January 1, 2018 | 309929000000 | 18724000000 |
| Tuesday, January 1, 2019 | 348871000000 | 19238000000 |
| Wednesday, January 1, 2020 | 398994000000 | 17618000000 |
| Friday, January 1, 2021 | 459628000000 | 17924000000 |
| Saturday, January 1, 2022 | 535943000000 | 19309000000 |
| Sunday, January 1, 2023 | 490157339000 | 21245000000 |
| Monday, January 1, 2024 | 499722880000 | 18975000000 |
Unleashing insights
In the ever-evolving landscape of technology, understanding the cost of revenue is crucial for assessing a company's financial health. Cisco Systems, Inc. and ASE Technology Holding Co., Ltd. offer a fascinating study in contrasts. From 2014 to 2023, ASE Technology's cost of revenue surged by approximately 141%, peaking in 2022. This growth reflects the company's expanding footprint in the semiconductor industry. In contrast, Cisco's cost of revenue remained relatively stable, with a modest increase of around 10% over the same period, highlighting its consistent operational efficiency. Notably, 2023 saw Cisco's cost of revenue reach its highest point, while ASE Technology experienced a slight dip. This data underscores the dynamic nature of the tech industry, where strategic investments and market conditions can significantly impact financial outcomes. Missing data for 2024 suggests a need for cautious optimism as both companies navigate future challenges.
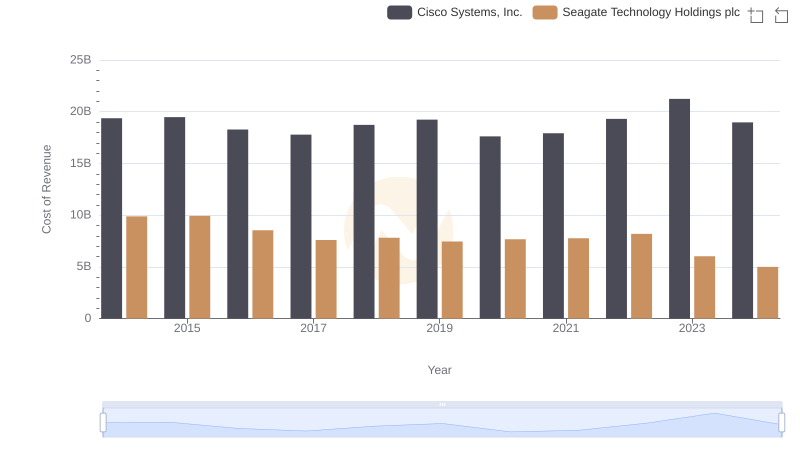
Analyzing Cost of Revenue: Cisco Systems, Inc. and Seagate Technology Holdings plc
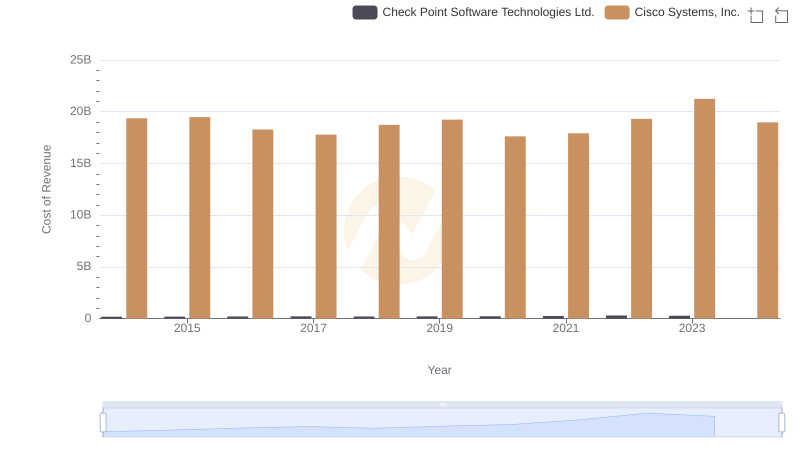
Cisco Systems, Inc. vs Check Point Software Technologies Ltd.: Efficiency in Cost of Revenue Explored
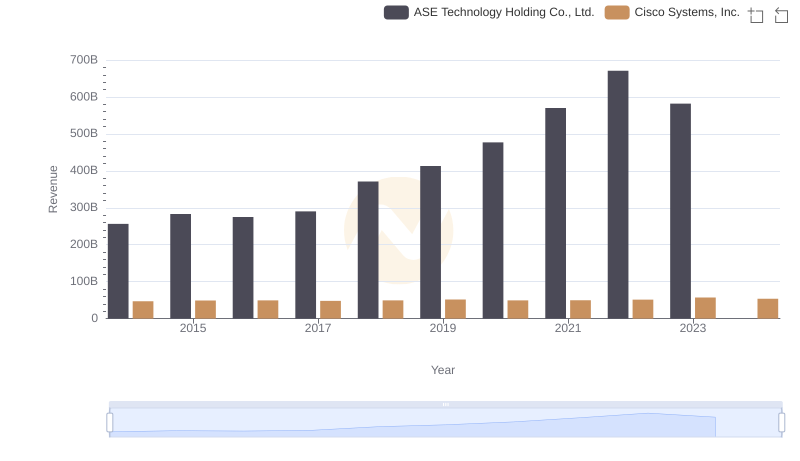
Cisco Systems, Inc. and ASE Technology Holding Co., Ltd.: A Comprehensive Revenue Analysis
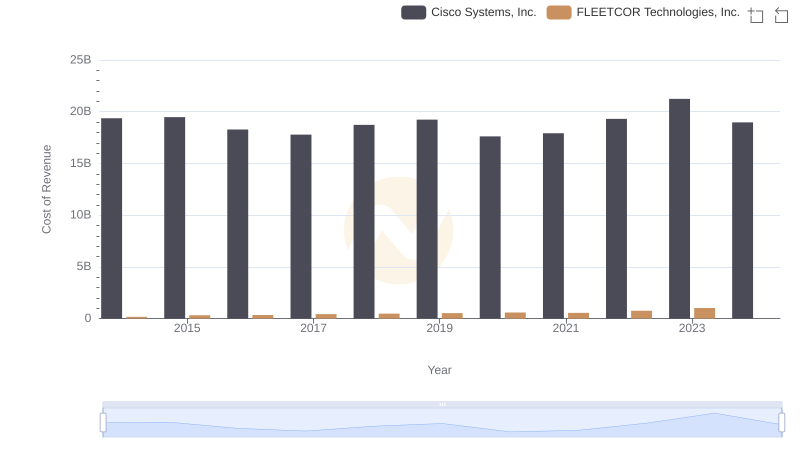
Cost Insights: Breaking Down Cisco Systems, Inc. and FLEETCOR Technologies, Inc.'s Expenses
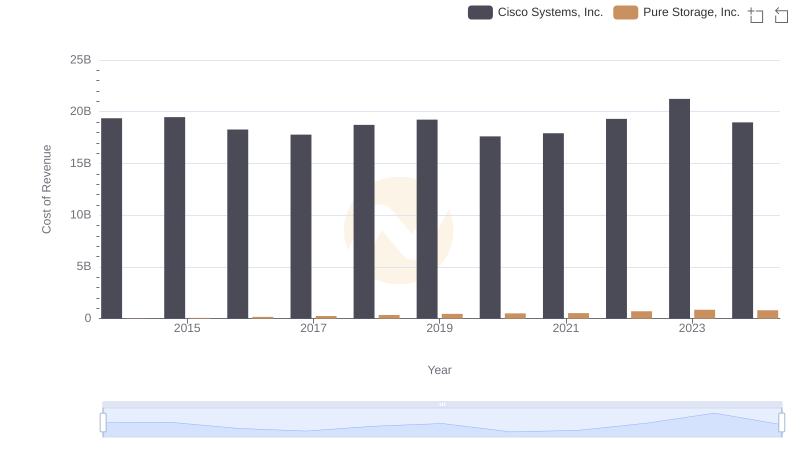
Cost of Revenue: Key Insights for Cisco Systems, Inc. and Pure Storage, Inc.
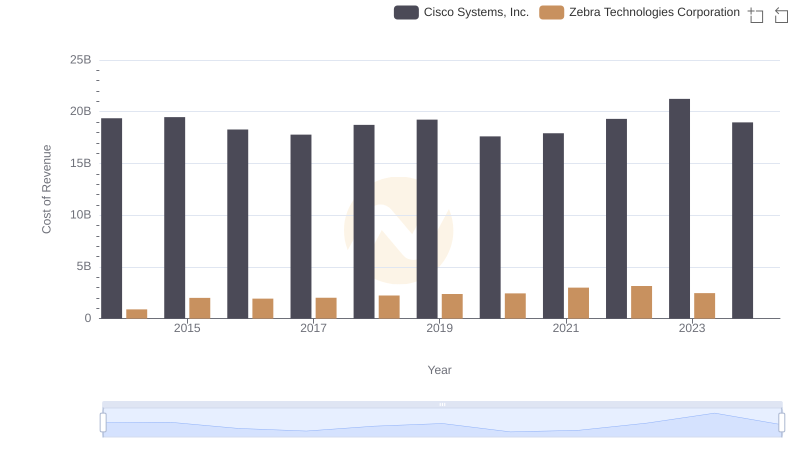
Cost Insights: Breaking Down Cisco Systems, Inc. and Zebra Technologies Corporation's Expenses
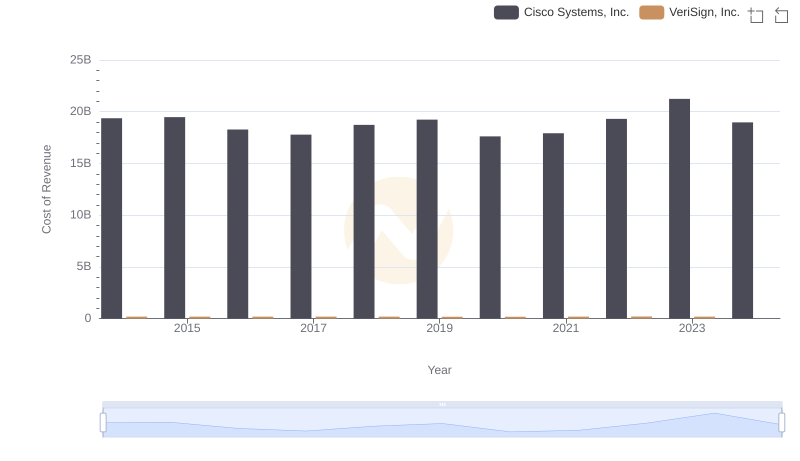
Cost of Revenue: Key Insights for Cisco Systems, Inc. and VeriSign, Inc.
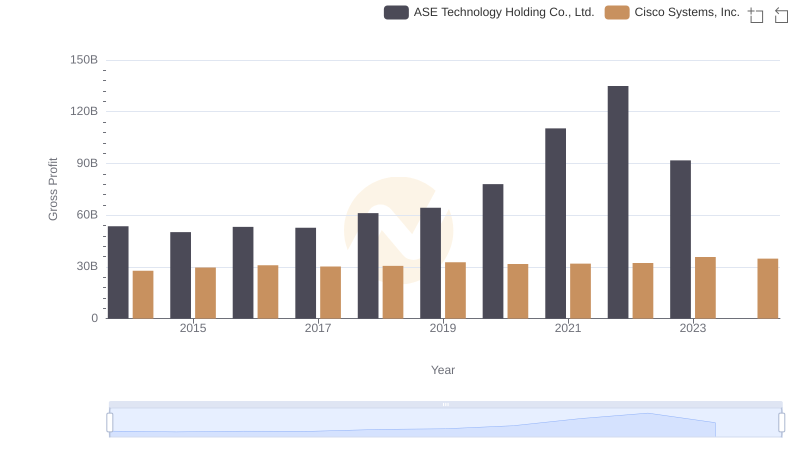
Cisco Systems, Inc. vs ASE Technology Holding Co., Ltd.: A Gross Profit Performance Breakdown
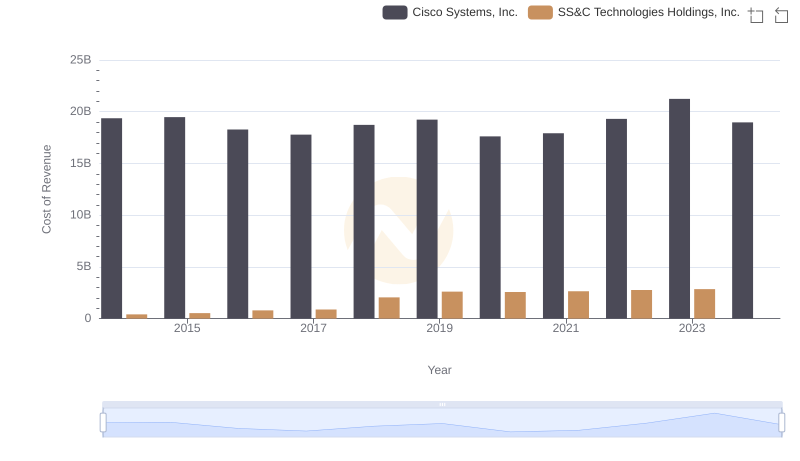
Cisco Systems, Inc. vs SS&C Technologies Holdings, Inc.: Efficiency in Cost of Revenue Explored
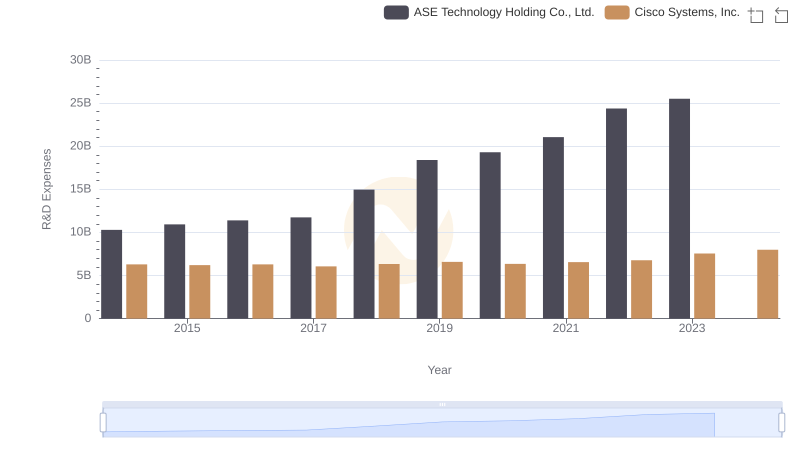
Cisco Systems, Inc. vs ASE Technology Holding Co., Ltd.: Strategic Focus on R&D Spending
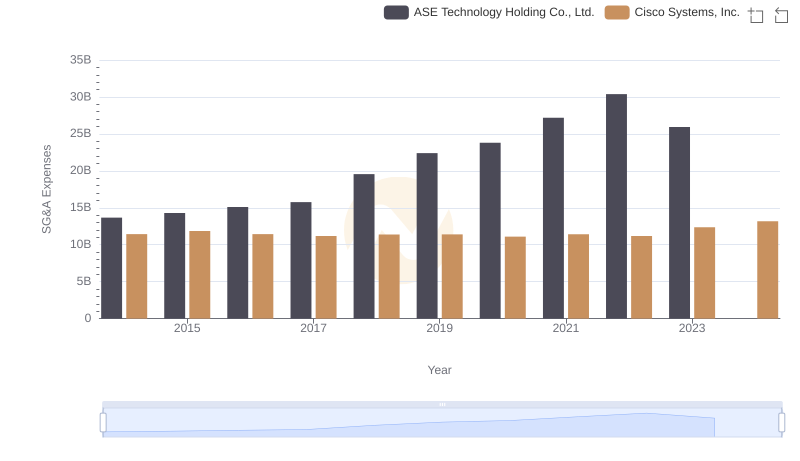
Cost Management Insights: SG&A Expenses for Cisco Systems, Inc. and ASE Technology Holding Co., Ltd.
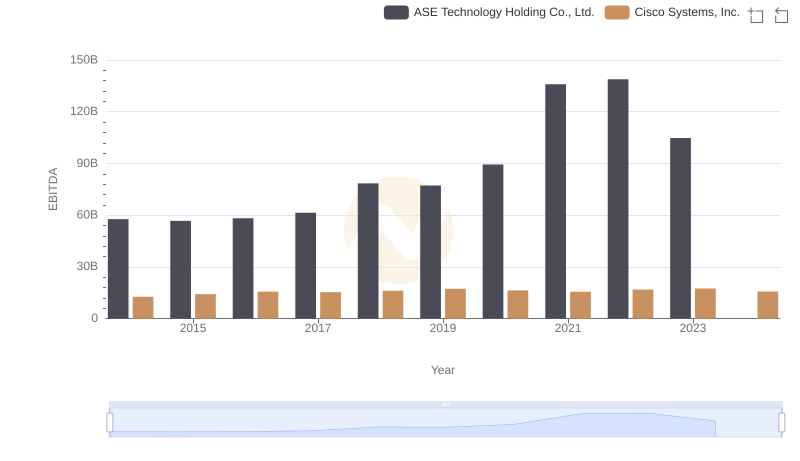
EBITDA Analysis: Evaluating Cisco Systems, Inc. Against ASE Technology Holding Co., Ltd.