| __timestamp | ASE Technology Holding Co., Ltd. | Cisco Systems, Inc. |
|---|---|---|
| Wednesday, January 1, 2014 | 57728376000 | 12709000000 |
| Thursday, January 1, 2015 | 56716330000 | 14209000000 |
| Friday, January 1, 2016 | 58196307000 | 15678000000 |
| Sunday, January 1, 2017 | 61377328000 | 15383000000 |
| Monday, January 1, 2018 | 78432873000 | 16172000000 |
| Tuesday, January 1, 2019 | 77173662000 | 17334000000 |
| Wednesday, January 1, 2020 | 89377502000 | 16363000000 |
| Friday, January 1, 2021 | 135966088000 | 15558000000 |
| Saturday, January 1, 2022 | 138852591000 | 16794000000 |
| Sunday, January 1, 2023 | 104757657000 | 17471000000 |
| Monday, January 1, 2024 | 104735170000 | 15747000000 |
Cracking the code
In the ever-evolving landscape of technology, understanding financial health is crucial. This analysis delves into the EBITDA performance of Cisco Systems, Inc. and ASE Technology Holding Co., Ltd. from 2014 to 2023. Over this period, ASE Technology's EBITDA surged by approximately 82%, peaking in 2022, while Cisco Systems exhibited a steady growth of around 38%, reaching its highest in 2023. Notably, ASE Technology's EBITDA consistently outpaced Cisco's, highlighting its robust financial growth. However, 2024 data for ASE Technology is missing, leaving a gap in the trend analysis. This comparison underscores the dynamic nature of the tech industry, where strategic financial management can lead to significant competitive advantages. Investors and stakeholders should consider these trends when making informed decisions in the tech sector.
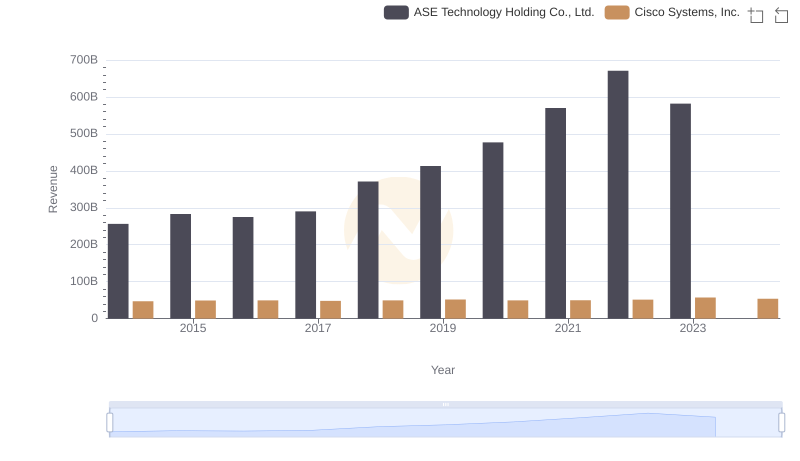
Cisco Systems, Inc. and ASE Technology Holding Co., Ltd.: A Comprehensive Revenue Analysis
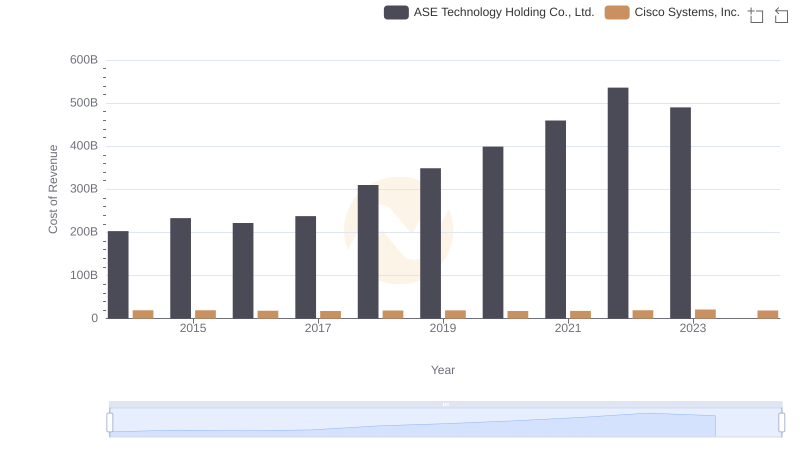
Analyzing Cost of Revenue: Cisco Systems, Inc. and ASE Technology Holding Co., Ltd.
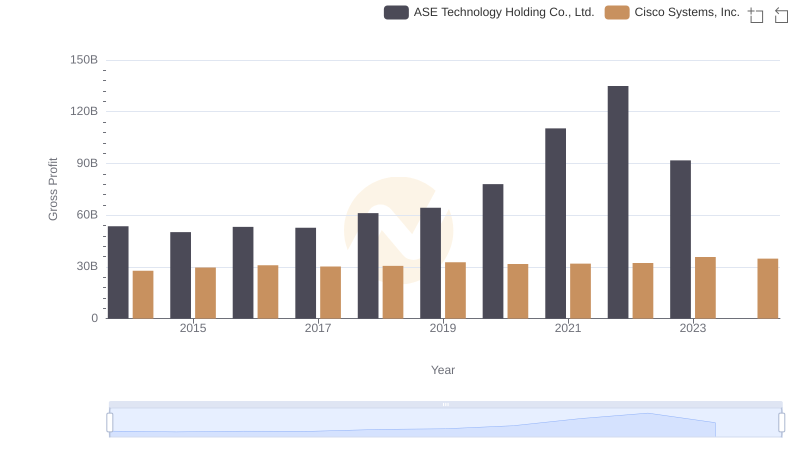
Cisco Systems, Inc. vs ASE Technology Holding Co., Ltd.: A Gross Profit Performance Breakdown
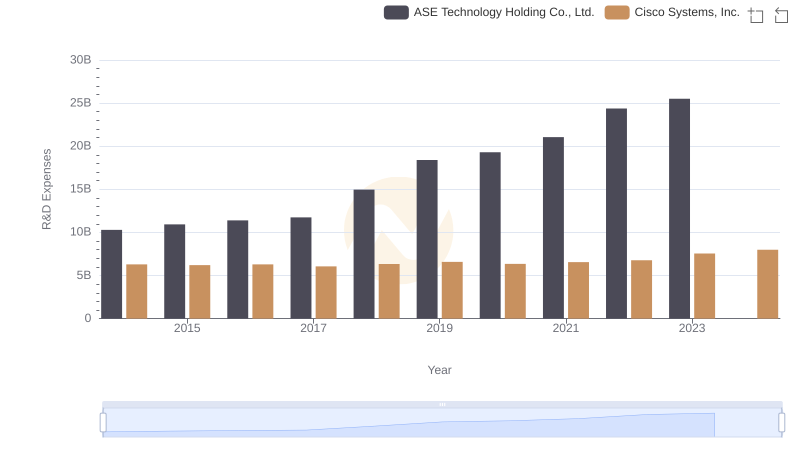
Cisco Systems, Inc. vs ASE Technology Holding Co., Ltd.: Strategic Focus on R&D Spending
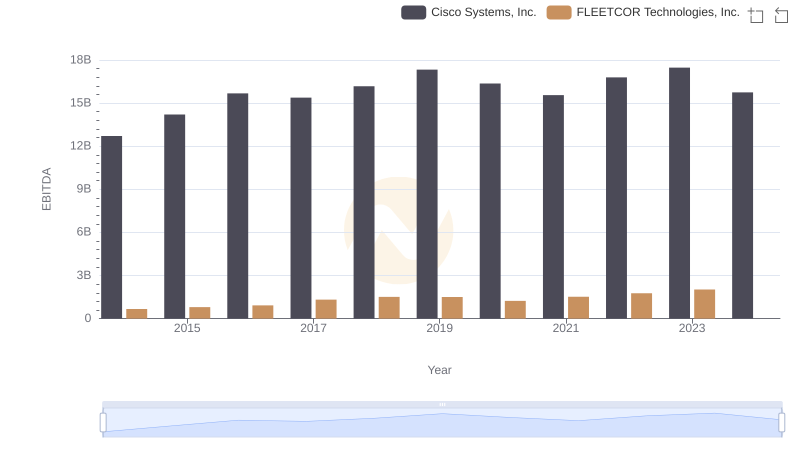
EBITDA Metrics Evaluated: Cisco Systems, Inc. vs FLEETCOR Technologies, Inc.
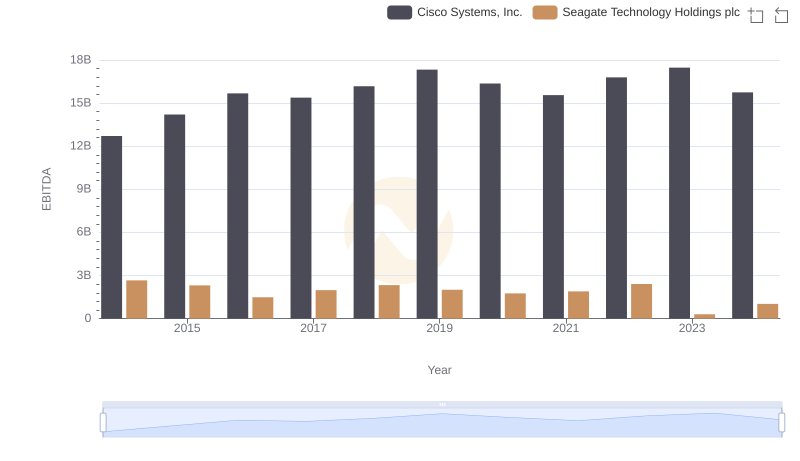
Cisco Systems, Inc. and Seagate Technology Holdings plc: A Detailed Examination of EBITDA Performance
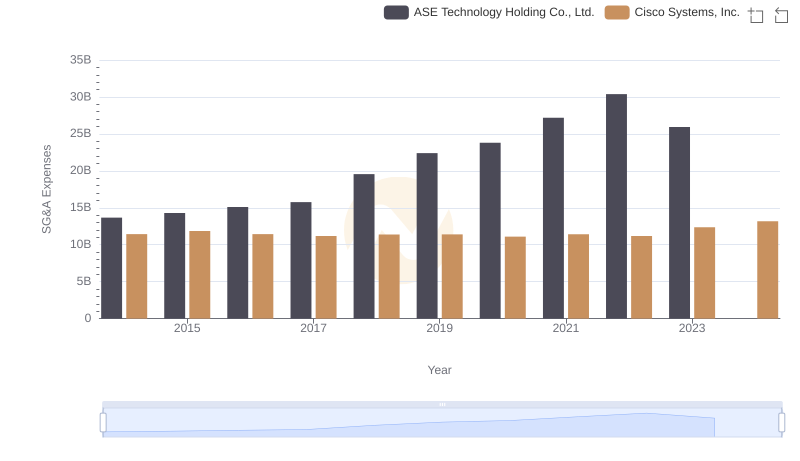
Cost Management Insights: SG&A Expenses for Cisco Systems, Inc. and ASE Technology Holding Co., Ltd.
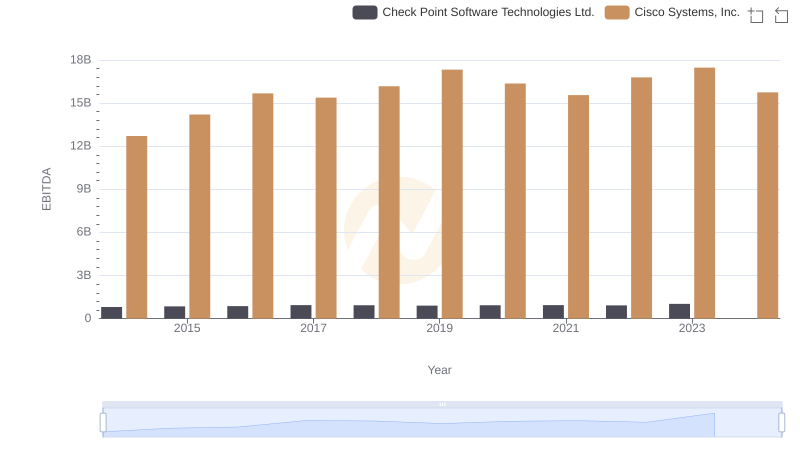
Comparative EBITDA Analysis: Cisco Systems, Inc. vs Check Point Software Technologies Ltd.
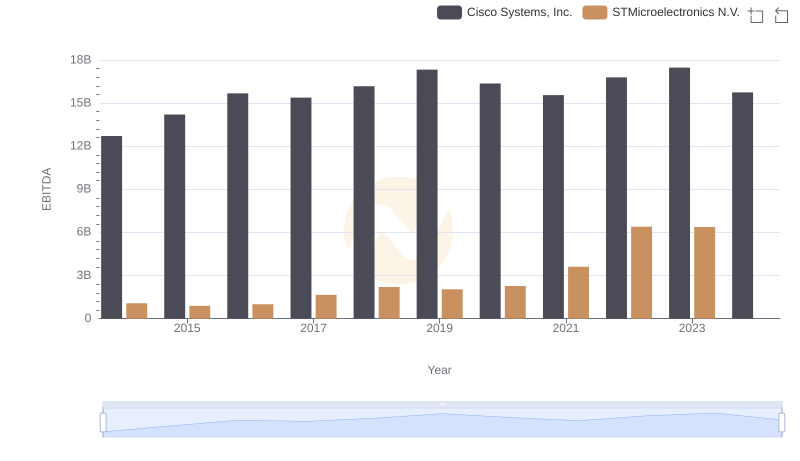
EBITDA Analysis: Evaluating Cisco Systems, Inc. Against STMicroelectronics N.V.
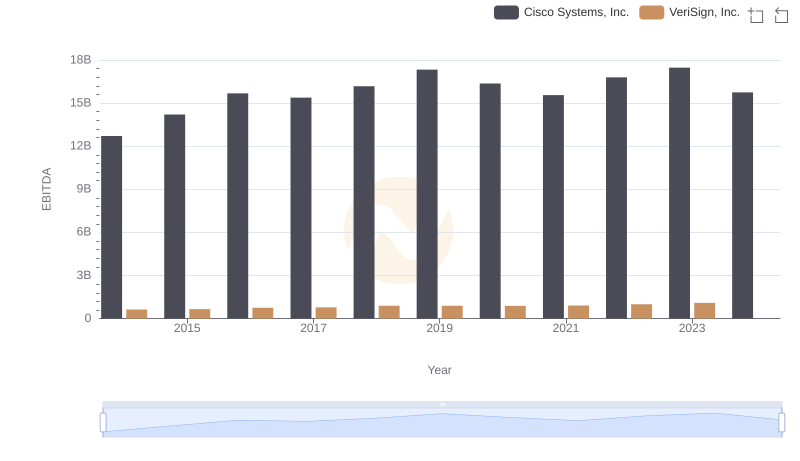
EBITDA Metrics Evaluated: Cisco Systems, Inc. vs VeriSign, Inc.
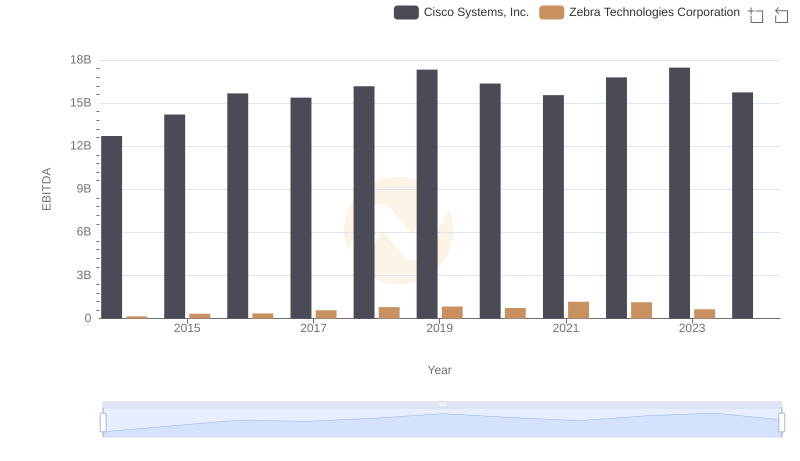
EBITDA Performance Review: Cisco Systems, Inc. vs Zebra Technologies Corporation
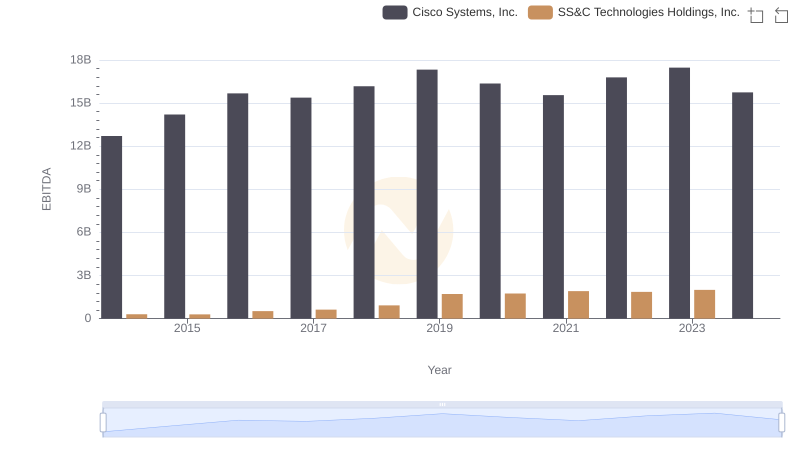
Cisco Systems, Inc. vs SS&C Technologies Holdings, Inc.: In-Depth EBITDA Performance Comparison