| __timestamp | Cisco Systems, Inc. | STMicroelectronics N.V. |
|---|---|---|
| Wednesday, January 1, 2014 | 11437000000 | 940000000 |
| Thursday, January 1, 2015 | 11861000000 | 891000000 |
| Friday, January 1, 2016 | 11433000000 | 933000000 |
| Sunday, January 1, 2017 | 11177000000 | 1001000000 |
| Monday, January 1, 2018 | 11386000000 | 1109000000 |
| Tuesday, January 1, 2019 | 11398000000 | 1093000000 |
| Wednesday, January 1, 2020 | 11094000000 | 1123000000 |
| Friday, January 1, 2021 | 11411000000 | 1319000000 |
| Saturday, January 1, 2022 | 11186000000 | 1428000000 |
| Sunday, January 1, 2023 | 12358000000 | 1650000000 |
| Monday, January 1, 2024 | 13177000000 |
Infusing magic into the data realm
In the ever-evolving tech industry, operational efficiency is key to maintaining a competitive edge. This analysis delves into the Selling, General, and Administrative (SG&A) expenses of two tech giants: Cisco Systems, Inc. and STMicroelectronics N.V., from 2014 to 2023. Over this period, Cisco consistently outspent STMicroelectronics, with its SG&A expenses peaking at approximately $13.2 billion in 2024, marking a 15% increase from 2014. In contrast, STMicroelectronics saw a steady rise, culminating in a 75% increase to $1.65 billion by 2023. This disparity highlights Cisco's expansive operational scale compared to STMicroelectronics. However, the upward trend in STMicroelectronics' expenses suggests strategic investments in growth. Notably, data for 2024 is incomplete for STMicroelectronics, indicating potential future insights. This analysis underscores the importance of SG&A management in sustaining growth and competitiveness in the tech sector.
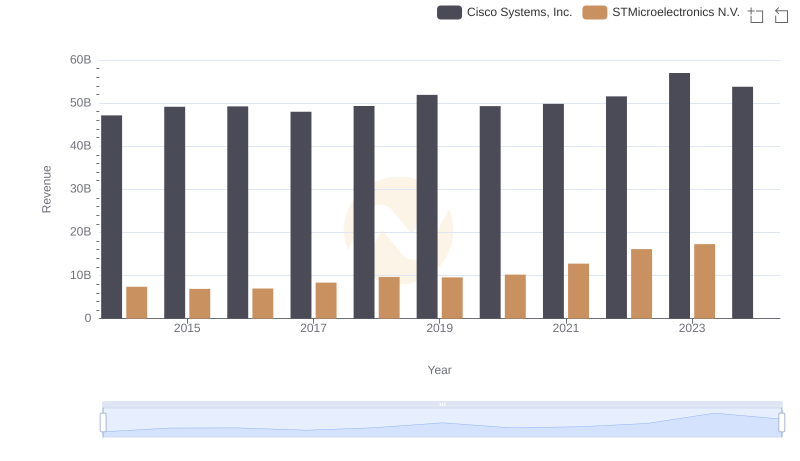
Cisco Systems, Inc. vs STMicroelectronics N.V.: Annual Revenue Growth Compared
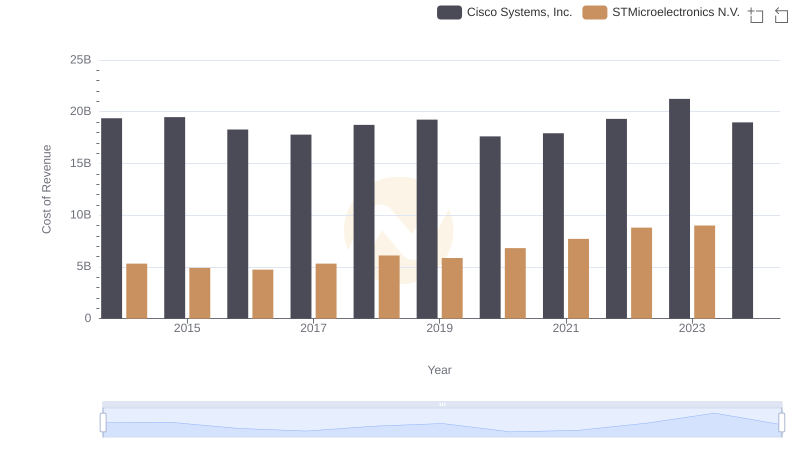
Cisco Systems, Inc. vs STMicroelectronics N.V.: Efficiency in Cost of Revenue Explored
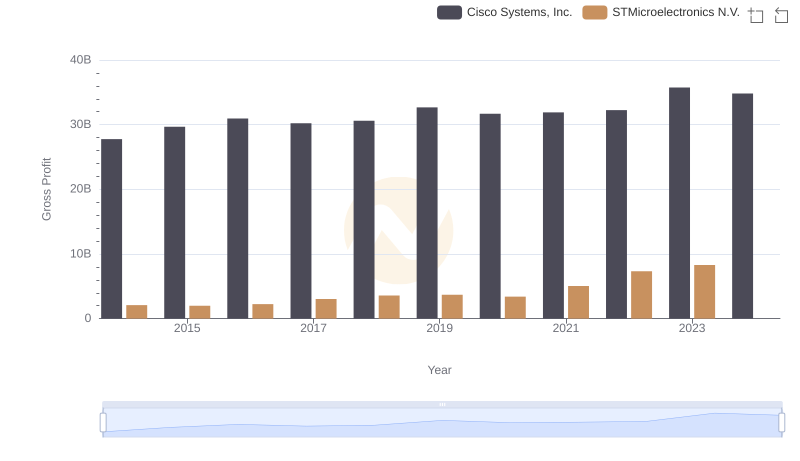
Cisco Systems, Inc. and STMicroelectronics N.V.: A Detailed Gross Profit Analysis
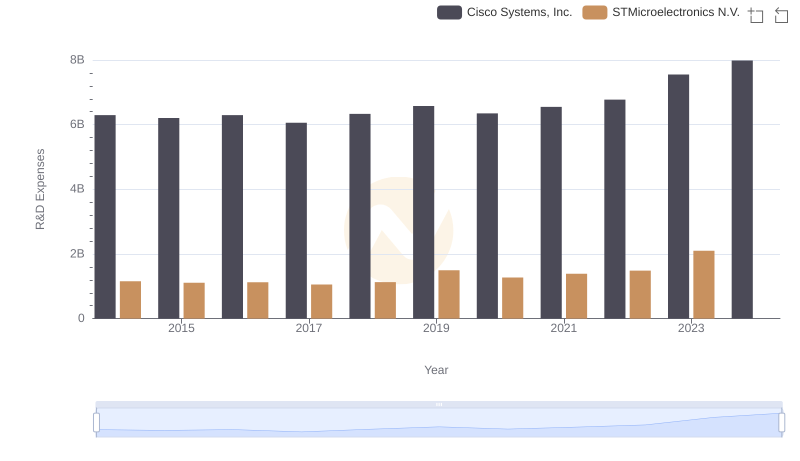
Analyzing R&D Budgets: Cisco Systems, Inc. vs STMicroelectronics N.V.
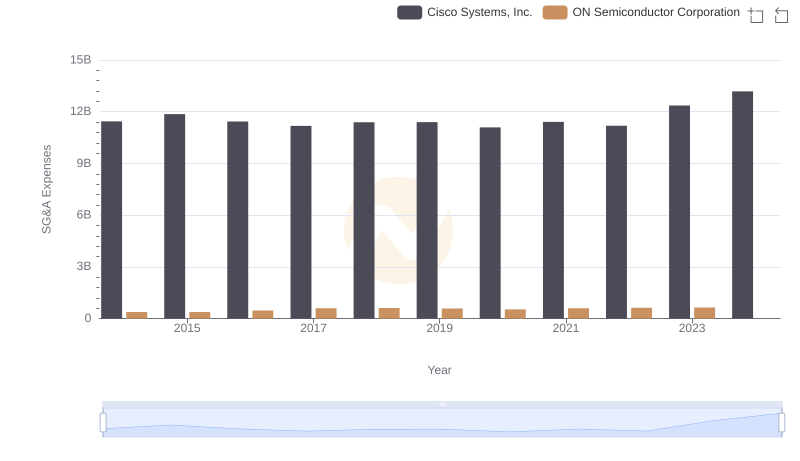
Selling, General, and Administrative Costs: Cisco Systems, Inc. vs ON Semiconductor Corporation
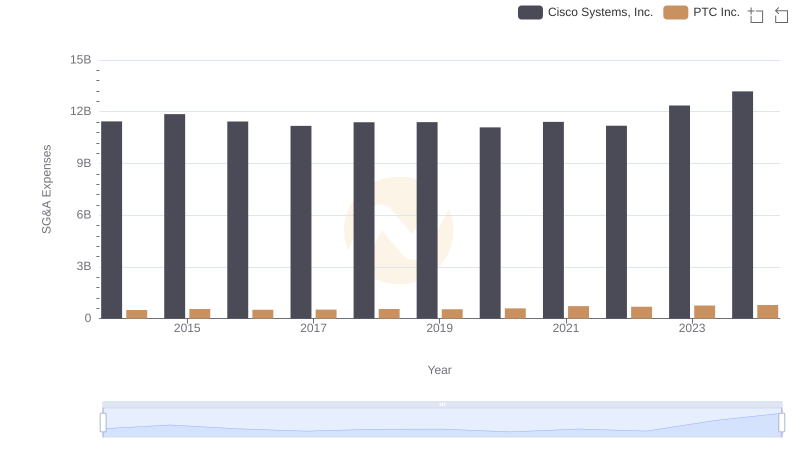
Cisco Systems, Inc. vs PTC Inc.: SG&A Expense Trends

Cisco Systems, Inc. vs FLEETCOR Technologies, Inc.: SG&A Expense Trends
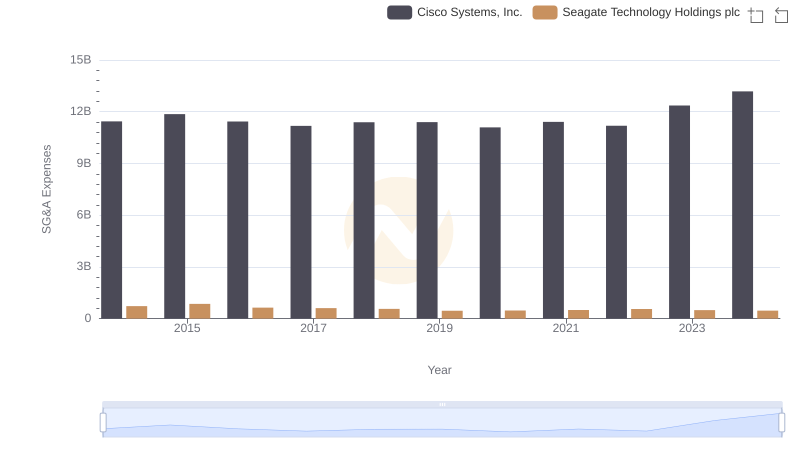
SG&A Efficiency Analysis: Comparing Cisco Systems, Inc. and Seagate Technology Holdings plc
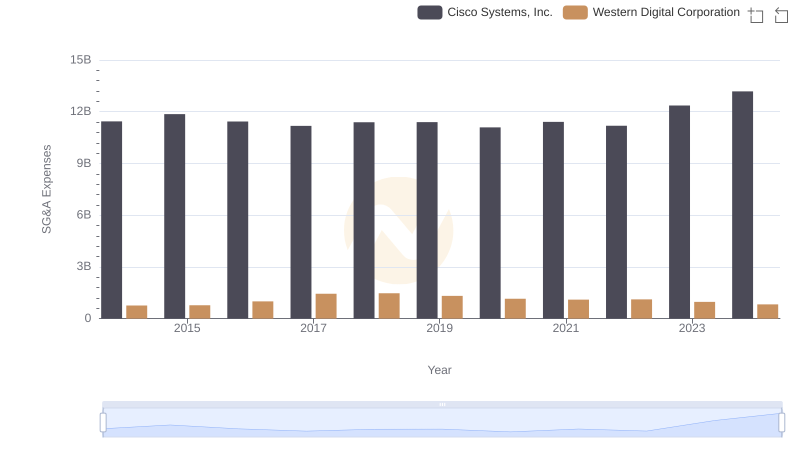
Breaking Down SG&A Expenses: Cisco Systems, Inc. vs Western Digital Corporation
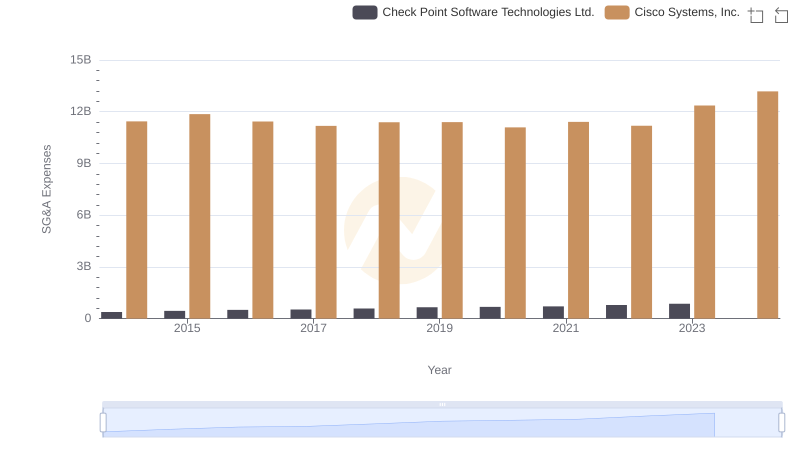
Cisco Systems, Inc. vs Check Point Software Technologies Ltd.: SG&A Expense Trends
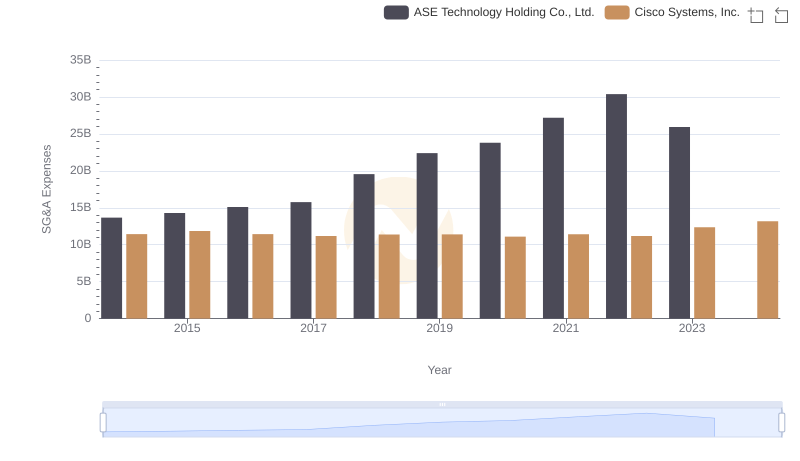
Cost Management Insights: SG&A Expenses for Cisco Systems, Inc. and ASE Technology Holding Co., Ltd.
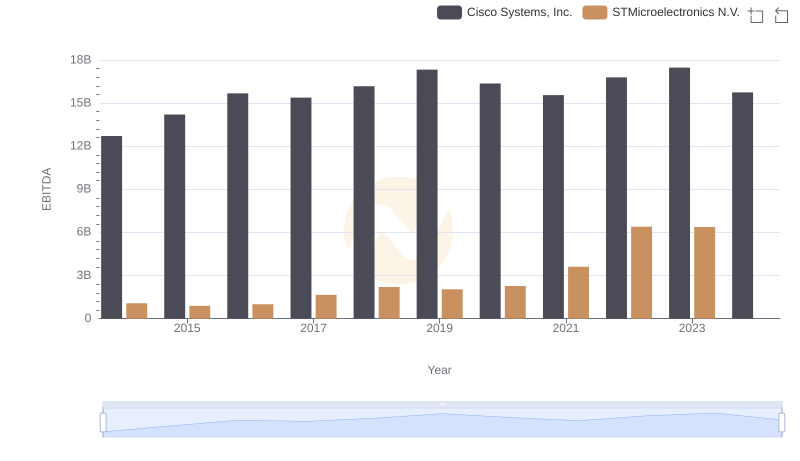
EBITDA Analysis: Evaluating Cisco Systems, Inc. Against STMicroelectronics N.V.