| __timestamp | Pentair plc | Watsco, Inc. |
|---|---|---|
| Wednesday, January 1, 2014 | 4563000000 | 2988138000 |
| Thursday, January 1, 2015 | 4263200000 | 3105882000 |
| Friday, January 1, 2016 | 3095900000 | 3186118000 |
| Sunday, January 1, 2017 | 3107400000 | 3276296000 |
| Monday, January 1, 2018 | 1917400000 | 3426401000 |
| Tuesday, January 1, 2019 | 1905700000 | 3613406000 |
| Wednesday, January 1, 2020 | 1960200000 | 3832107000 |
| Friday, January 1, 2021 | 2445600000 | 4612647000 |
| Saturday, January 1, 2022 | 2757200000 | 5244055000 |
| Sunday, January 1, 2023 | 2585300000 | 5291627000 |
| Monday, January 1, 2024 | 2484000000 | 5573604000 |
Cracking the code
In the ever-evolving landscape of industrial manufacturing, understanding cost dynamics is crucial. This analysis delves into the cost of revenue trends for two industry giants: Watsco, Inc. and Pentair plc, from 2014 to 2023. Over this period, Watsco, Inc. has demonstrated a robust upward trajectory, with its cost of revenue increasing by approximately 77%, peaking in 2023. In contrast, Pentair plc experienced a significant decline of about 43% from its 2014 high, reflecting strategic shifts and market adaptations.
These trends offer a window into the strategic priorities and market responses of these companies, providing valuable insights for investors and industry analysts alike.
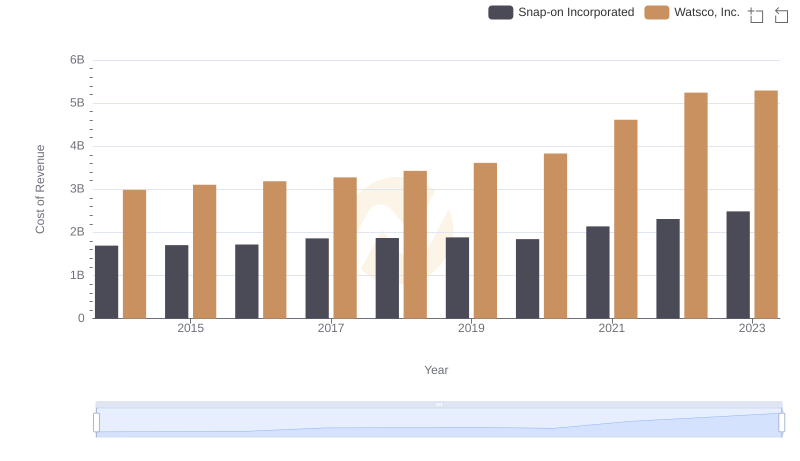
Cost Insights: Breaking Down Watsco, Inc. and Snap-on Incorporated's Expenses
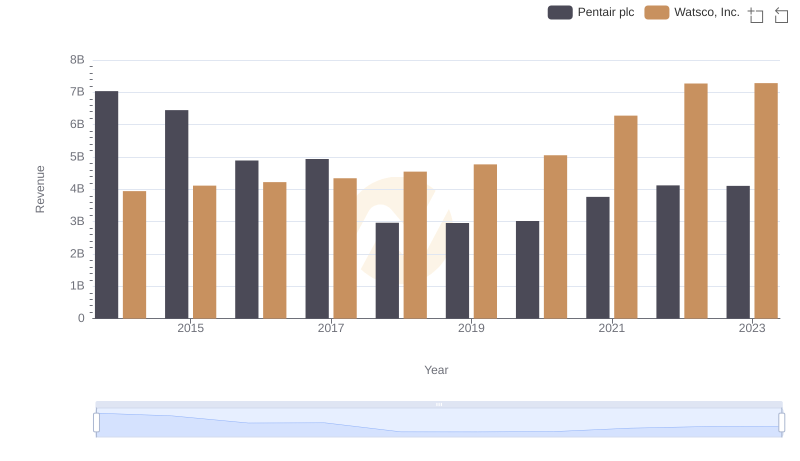
Revenue Insights: Watsco, Inc. and Pentair plc Performance Compared
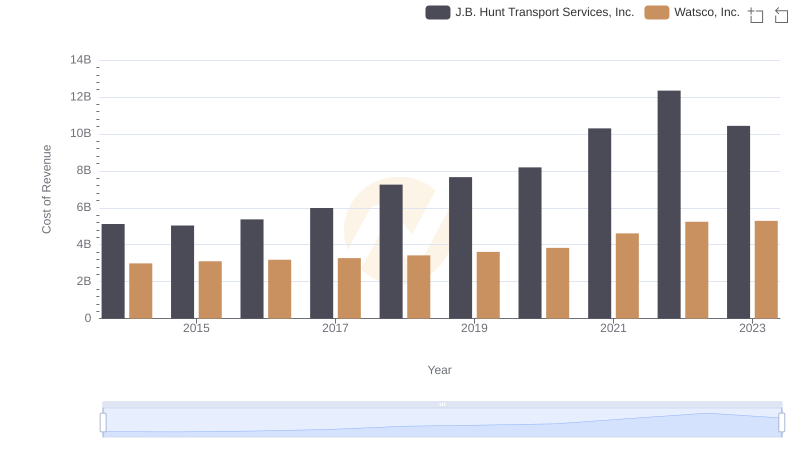
Cost Insights: Breaking Down Watsco, Inc. and J.B. Hunt Transport Services, Inc.'s Expenses
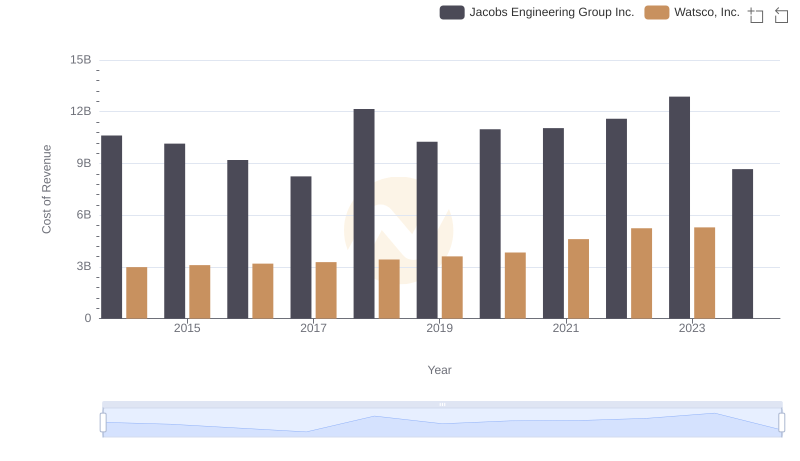
Cost of Revenue: Key Insights for Watsco, Inc. and Jacobs Engineering Group Inc.
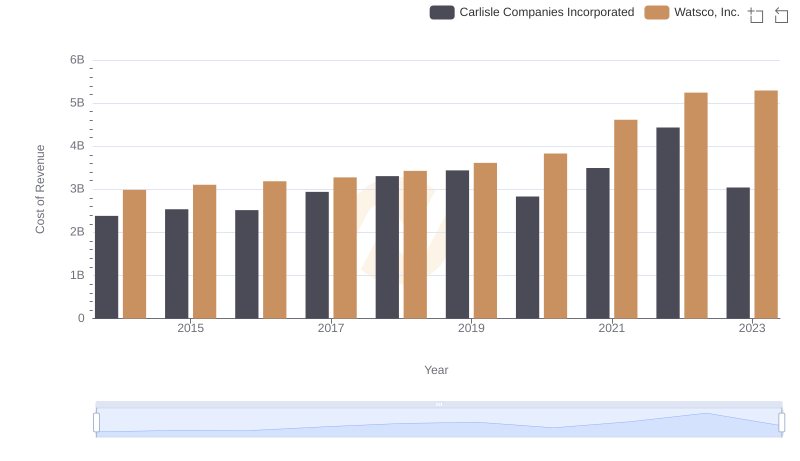
Cost Insights: Breaking Down Watsco, Inc. and Carlisle Companies Incorporated's Expenses
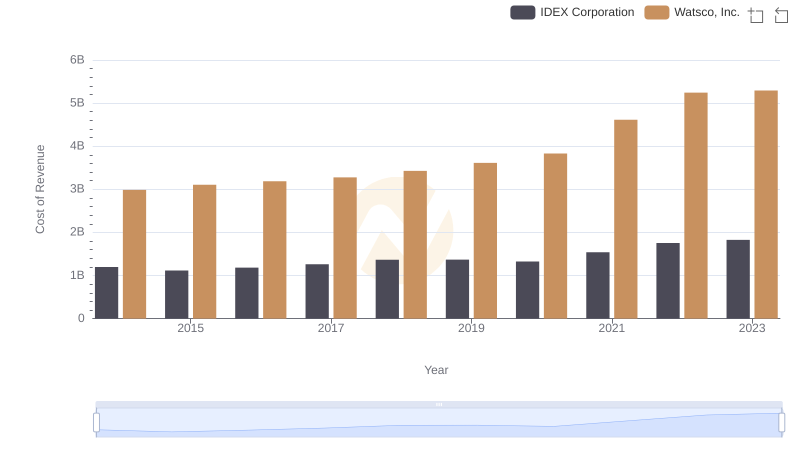
Cost Insights: Breaking Down Watsco, Inc. and IDEX Corporation's Expenses
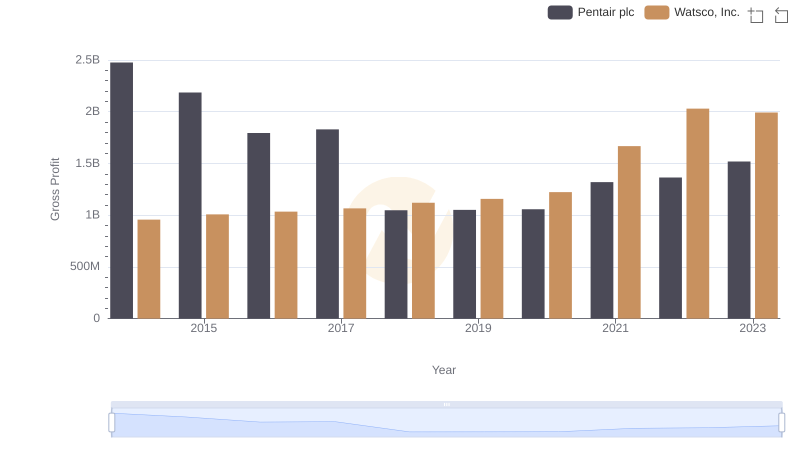
Gross Profit Comparison: Watsco, Inc. and Pentair plc Trends
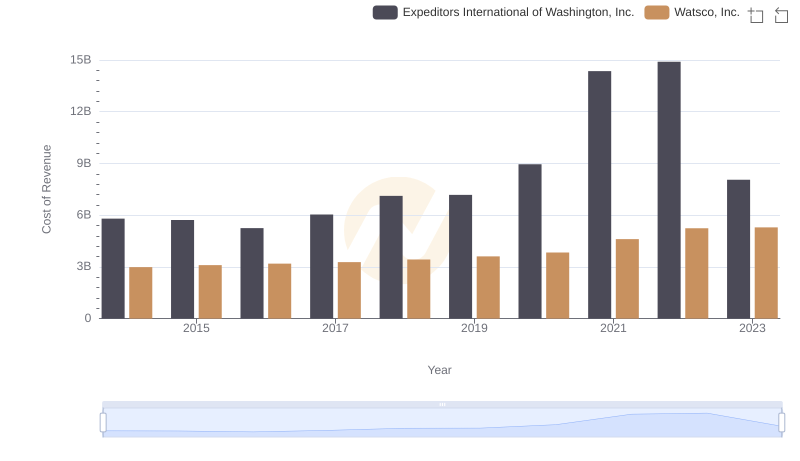
Cost of Revenue: Key Insights for Watsco, Inc. and Expeditors International of Washington, Inc.
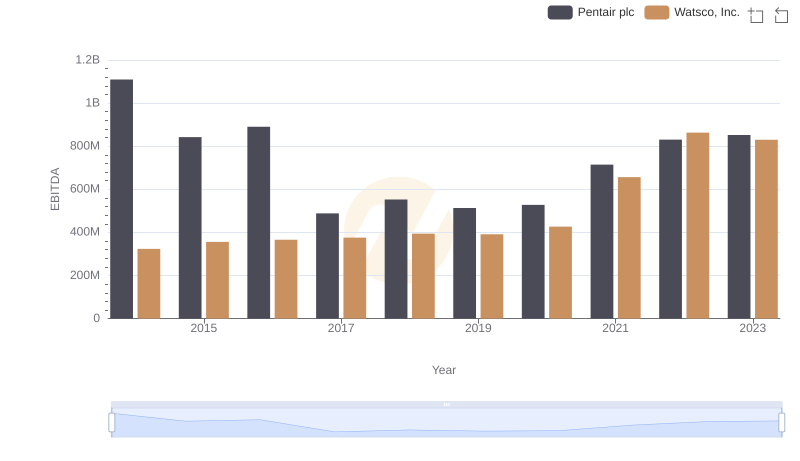
EBITDA Performance Review: Watsco, Inc. vs Pentair plc