| __timestamp | J.B. Hunt Transport Services, Inc. | Watsco, Inc. |
|---|---|---|
| Wednesday, January 1, 2014 | 6165441000 | 3944540000 |
| Thursday, January 1, 2015 | 6187646000 | 4113239000 |
| Friday, January 1, 2016 | 6555459000 | 4220702000 |
| Sunday, January 1, 2017 | 7189568000 | 4341955000 |
| Monday, January 1, 2018 | 8614874000 | 4546653000 |
| Tuesday, January 1, 2019 | 9165258000 | 4770362000 |
| Wednesday, January 1, 2020 | 9636573000 | 5054928000 |
| Friday, January 1, 2021 | 12168302000 | 6280192000 |
| Saturday, January 1, 2022 | 14813999000 | 7274344000 |
| Sunday, January 1, 2023 | 12829665000 | 7283767000 |
| Monday, January 1, 2024 | 7618317000 |
Data in motion
In the ever-evolving landscape of American business, Watsco, Inc. and J.B. Hunt Transport Services, Inc. stand as titans in their respective industries. Over the past decade, these companies have demonstrated remarkable revenue growth, reflecting broader economic trends and their strategic prowess.
From 2014 to 2023, J.B. Hunt's revenue surged by over 108%, peaking in 2022, before a slight dip in 2023. This growth underscores the company's adaptability in the logistics sector, even amidst global supply chain challenges. Meanwhile, Watsco, a leader in HVAC distribution, saw its revenue grow by approximately 85% during the same period, highlighting its resilience and the increasing demand for climate control solutions.
These trends not only showcase the companies' individual strengths but also mirror the dynamic shifts in the U.S. economy, where innovation and adaptability are key to sustained success.
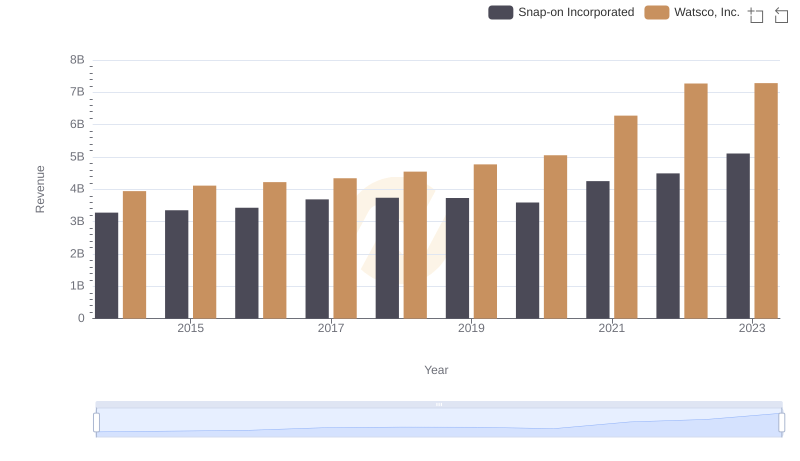
Watsco, Inc. and Snap-on Incorporated: A Comprehensive Revenue Analysis
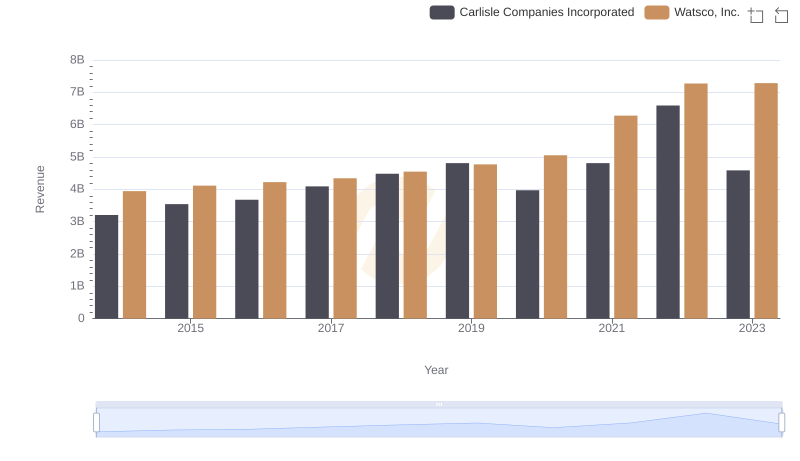
Annual Revenue Comparison: Watsco, Inc. vs Carlisle Companies Incorporated
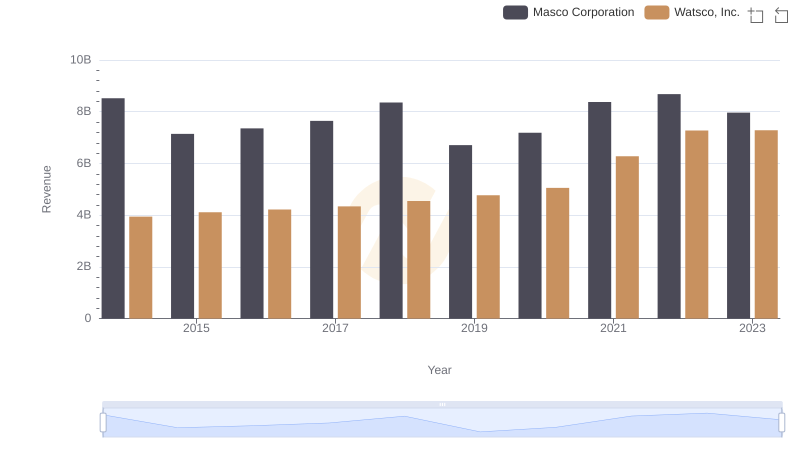
Revenue Insights: Watsco, Inc. and Masco Corporation Performance Compared
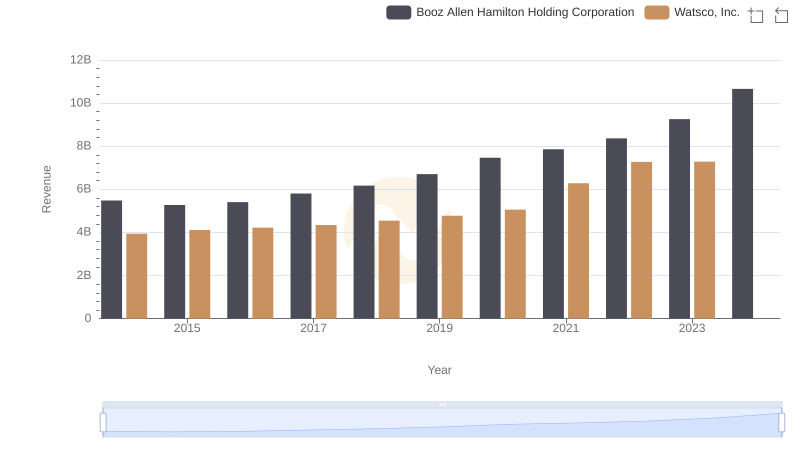
Watsco, Inc. vs Booz Allen Hamilton Holding Corporation: Annual Revenue Growth Compared
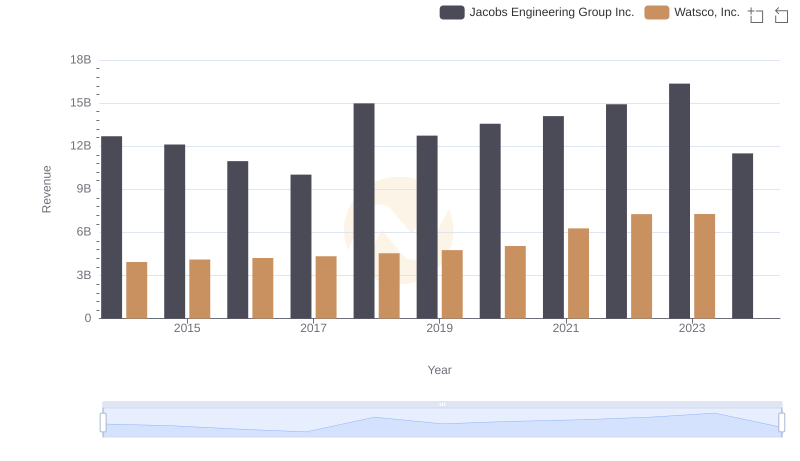
Breaking Down Revenue Trends: Watsco, Inc. vs Jacobs Engineering Group Inc.
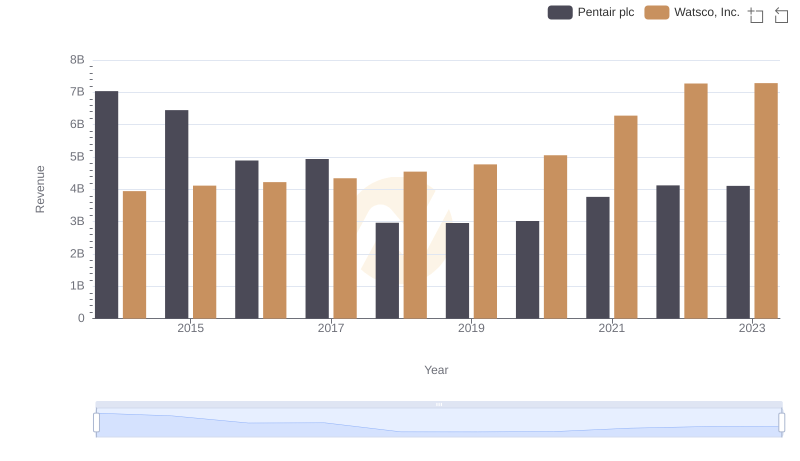
Revenue Insights: Watsco, Inc. and Pentair plc Performance Compared
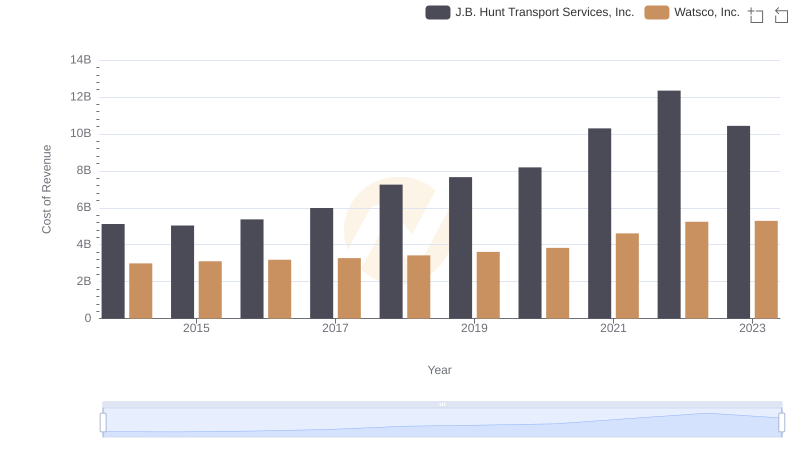
Cost Insights: Breaking Down Watsco, Inc. and J.B. Hunt Transport Services, Inc.'s Expenses
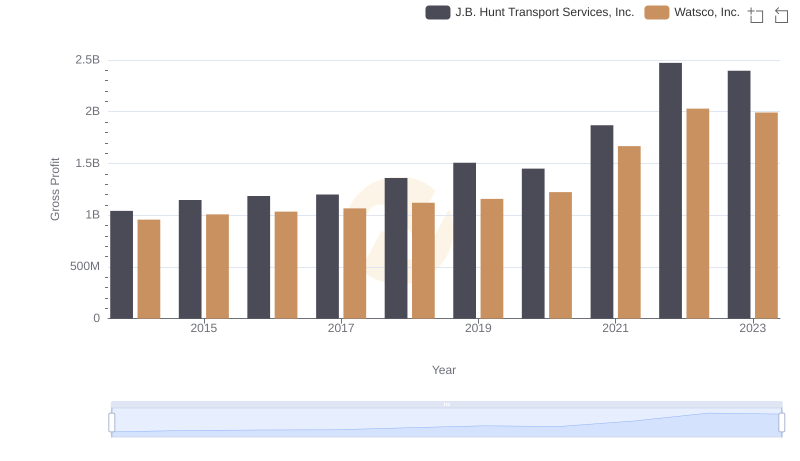
Key Insights on Gross Profit: Watsco, Inc. vs J.B. Hunt Transport Services, Inc.
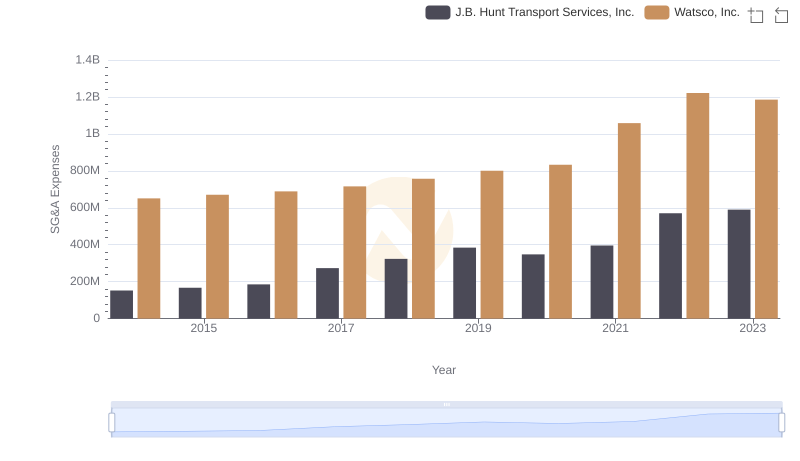
Operational Costs Compared: SG&A Analysis of Watsco, Inc. and J.B. Hunt Transport Services, Inc.
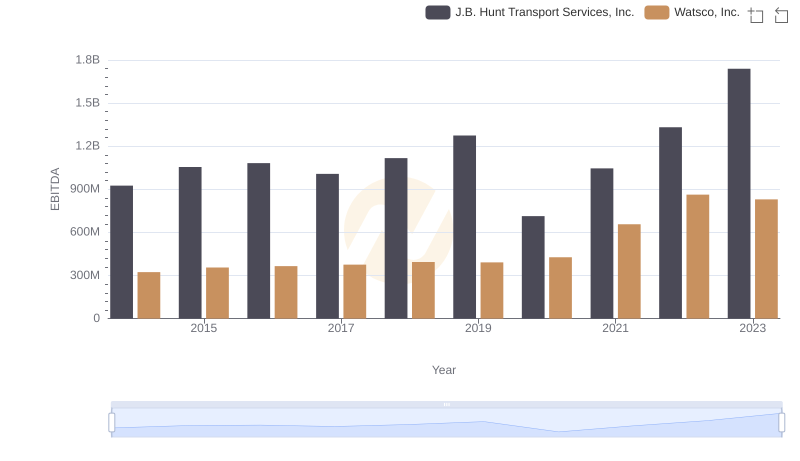
A Professional Review of EBITDA: Watsco, Inc. Compared to J.B. Hunt Transport Services, Inc.