| __timestamp | J.B. Hunt Transport Services, Inc. | Watsco, Inc. |
|---|---|---|
| Wednesday, January 1, 2014 | 926038000 | 323674000 |
| Thursday, January 1, 2015 | 1055307000 | 355865000 |
| Friday, January 1, 2016 | 1082601000 | 365698000 |
| Sunday, January 1, 2017 | 1007307000 | 375907000 |
| Monday, January 1, 2018 | 1116914000 | 394177000 |
| Tuesday, January 1, 2019 | 1274241000 | 391396000 |
| Wednesday, January 1, 2020 | 713119000 | 426942000 |
| Friday, January 1, 2021 | 1045530000 | 656655000 |
| Saturday, January 1, 2022 | 1331553000 | 863261000 |
| Sunday, January 1, 2023 | 1738774000 | 829900000 |
| Monday, January 1, 2024 | 781775000 |
Unleashing the power of data
In the ever-evolving landscape of American business, the financial health of companies is often gauged by their EBITDA, a key indicator of operational performance. Over the past decade, J.B. Hunt Transport Services, Inc. has consistently outperformed Watsco, Inc. in terms of EBITDA growth. From 2014 to 2023, J.B. Hunt's EBITDA surged by approximately 88%, peaking in 2023, while Watsco's EBITDA grew by around 156%, reaching its zenith in 2022. This remarkable growth trajectory highlights the resilience and strategic prowess of these industry giants. Notably, J.B. Hunt's EBITDA dipped in 2020, reflecting the pandemic's impact, but rebounded strongly thereafter. Meanwhile, Watsco's steady climb underscores its robust market position. As we look to the future, these trends offer valuable insights into the competitive dynamics of the logistics and HVAC sectors.
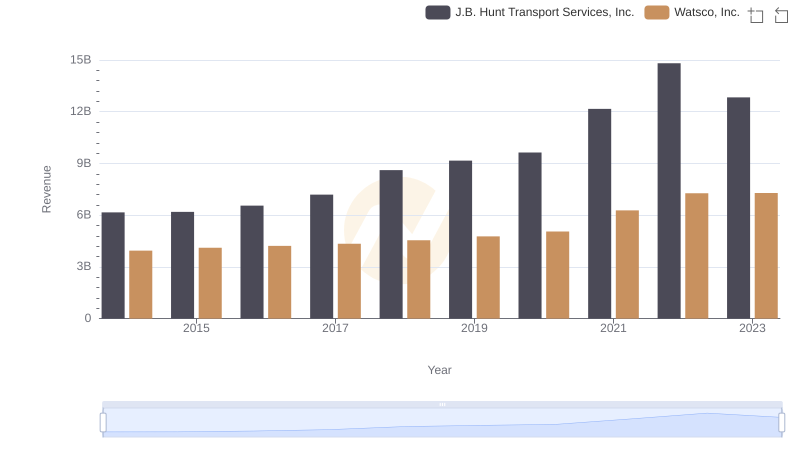
Watsco, Inc. vs J.B. Hunt Transport Services, Inc.: Annual Revenue Growth Compared
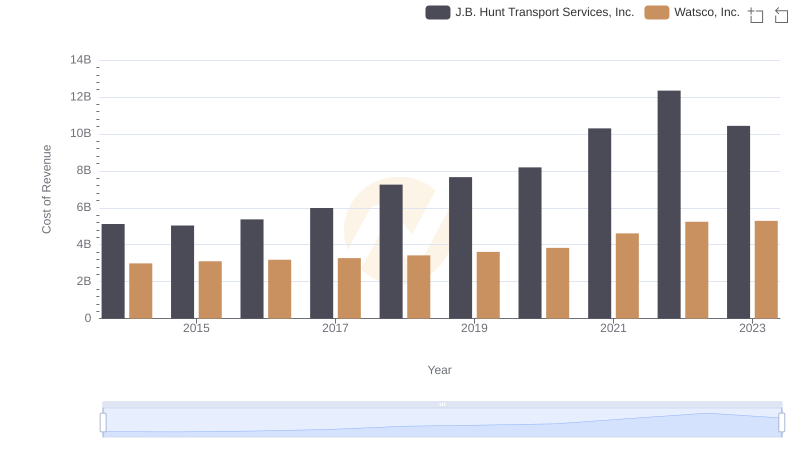
Cost Insights: Breaking Down Watsco, Inc. and J.B. Hunt Transport Services, Inc.'s Expenses
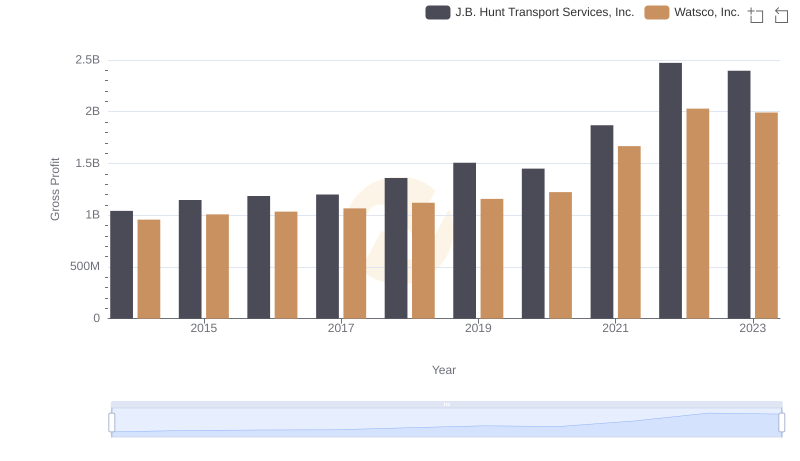
Key Insights on Gross Profit: Watsco, Inc. vs J.B. Hunt Transport Services, Inc.
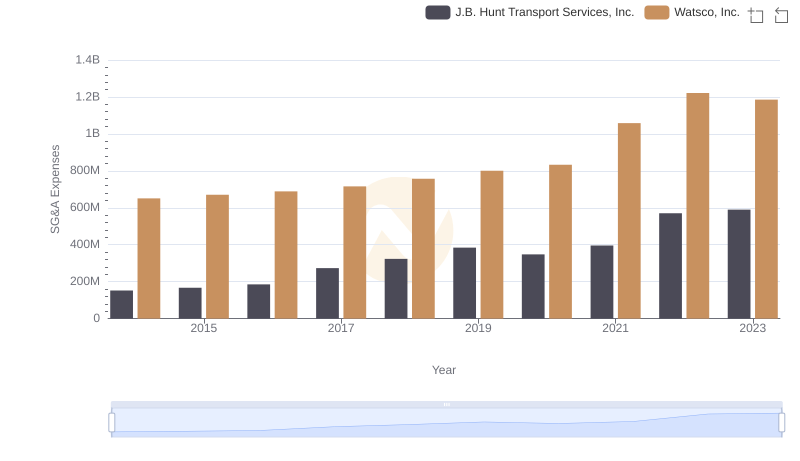
Operational Costs Compared: SG&A Analysis of Watsco, Inc. and J.B. Hunt Transport Services, Inc.
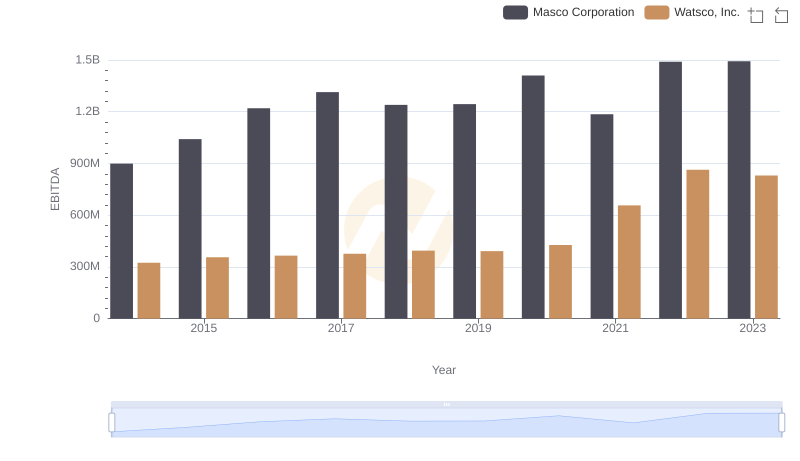
Comparative EBITDA Analysis: Watsco, Inc. vs Masco Corporation
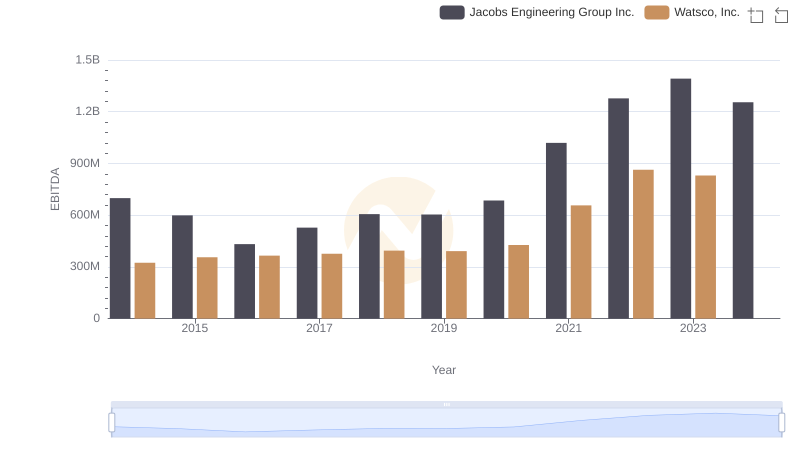
Professional EBITDA Benchmarking: Watsco, Inc. vs Jacobs Engineering Group Inc.
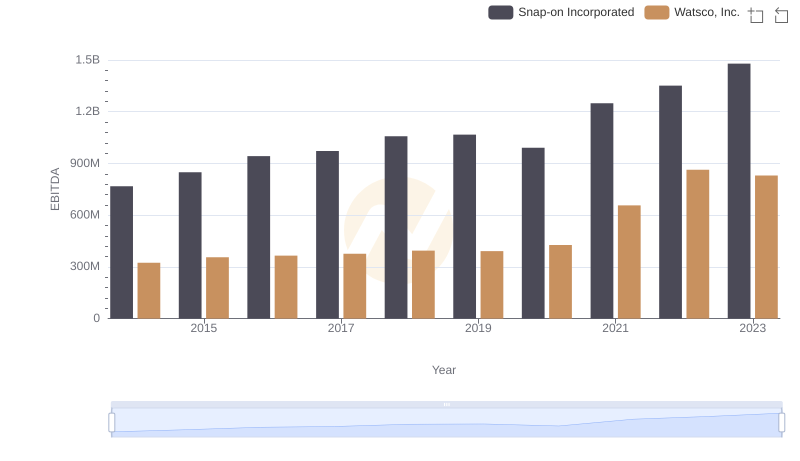
Comparative EBITDA Analysis: Watsco, Inc. vs Snap-on Incorporated
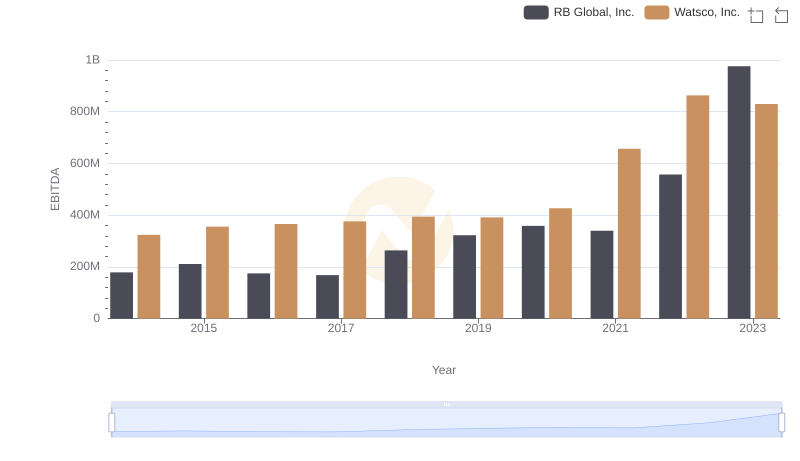
Comprehensive EBITDA Comparison: Watsco, Inc. vs RB Global, Inc.