| __timestamp | Carlisle Companies Incorporated | Watsco, Inc. |
|---|---|---|
| Wednesday, January 1, 2014 | 3204000000 | 3944540000 |
| Thursday, January 1, 2015 | 3543200000 | 4113239000 |
| Friday, January 1, 2016 | 3675400000 | 4220702000 |
| Sunday, January 1, 2017 | 4089900000 | 4341955000 |
| Monday, January 1, 2018 | 4479500000 | 4546653000 |
| Tuesday, January 1, 2019 | 4811600000 | 4770362000 |
| Wednesday, January 1, 2020 | 3969900000 | 5054928000 |
| Friday, January 1, 2021 | 4810300000 | 6280192000 |
| Saturday, January 1, 2022 | 6591900000 | 7274344000 |
| Sunday, January 1, 2023 | 4586900000 | 7283767000 |
| Monday, January 1, 2024 | 5003600000 | 7618317000 |
Cracking the code
In the ever-evolving landscape of industrial and building products, Watsco, Inc. and Carlisle Companies Incorporated have emerged as formidable players. Over the past decade, from 2014 to 2023, these companies have demonstrated remarkable revenue growth, reflecting their strategic prowess and market adaptability.
Watsco, Inc. has consistently outperformed Carlisle Companies in terms of revenue, with a notable 85% increase from 2014 to 2023. In 2022, Watsco's revenue peaked at approximately $7.28 billion, a testament to its robust business model and market demand. Meanwhile, Carlisle Companies experienced a significant revenue surge of 105% from 2014 to 2022, reaching a high of $6.59 billion, before a slight dip in 2023.
The data underscores the resilience and growth potential of these industry giants, even amidst economic fluctuations. As the market continues to evolve, both companies are well-positioned to capitalize on emerging opportunities.
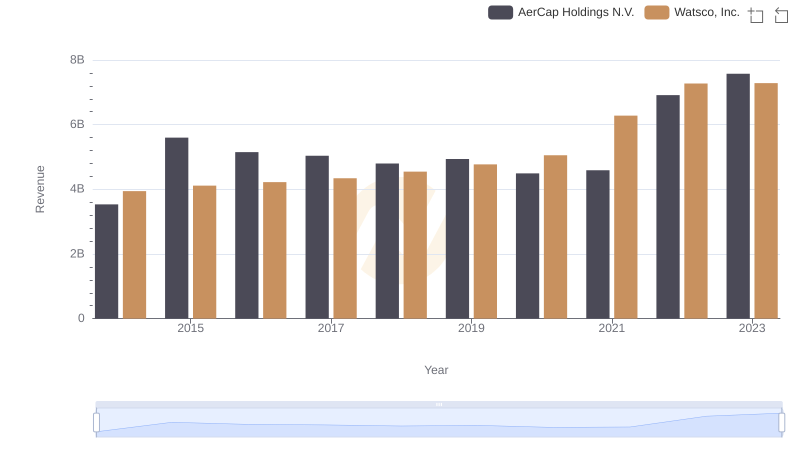
Watsco, Inc. vs AerCap Holdings N.V.: Examining Key Revenue Metrics
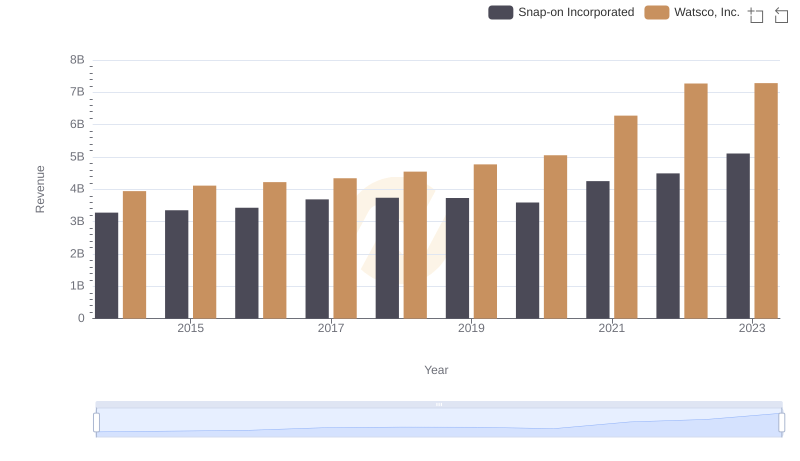
Watsco, Inc. and Snap-on Incorporated: A Comprehensive Revenue Analysis
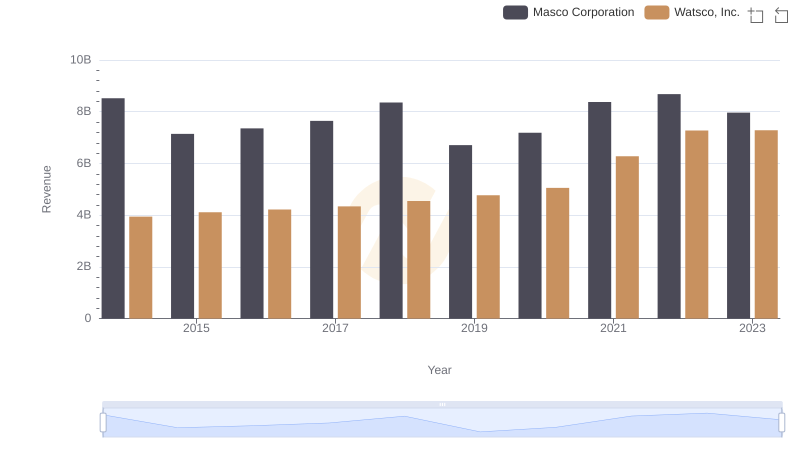
Revenue Insights: Watsco, Inc. and Masco Corporation Performance Compared
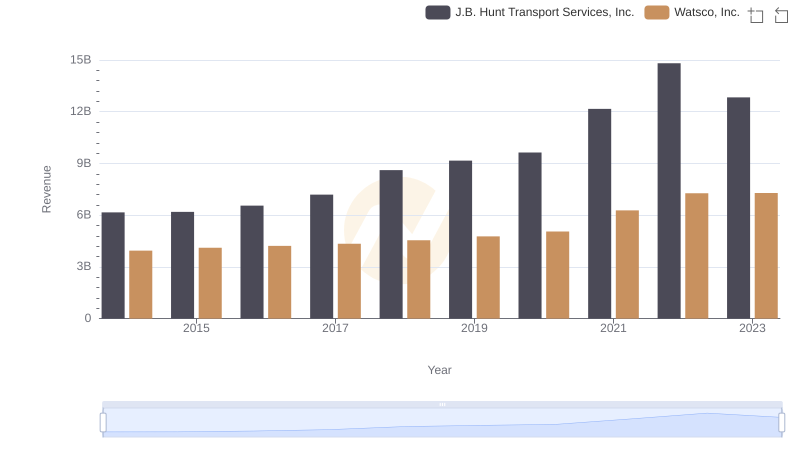
Watsco, Inc. vs J.B. Hunt Transport Services, Inc.: Annual Revenue Growth Compared
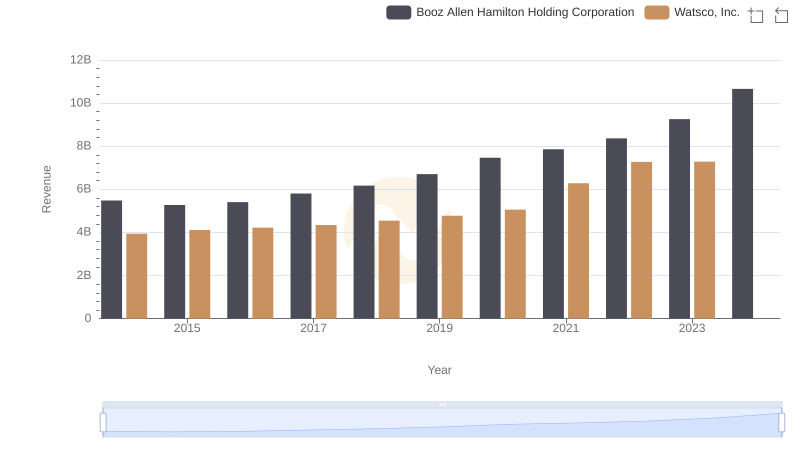
Watsco, Inc. vs Booz Allen Hamilton Holding Corporation: Annual Revenue Growth Compared
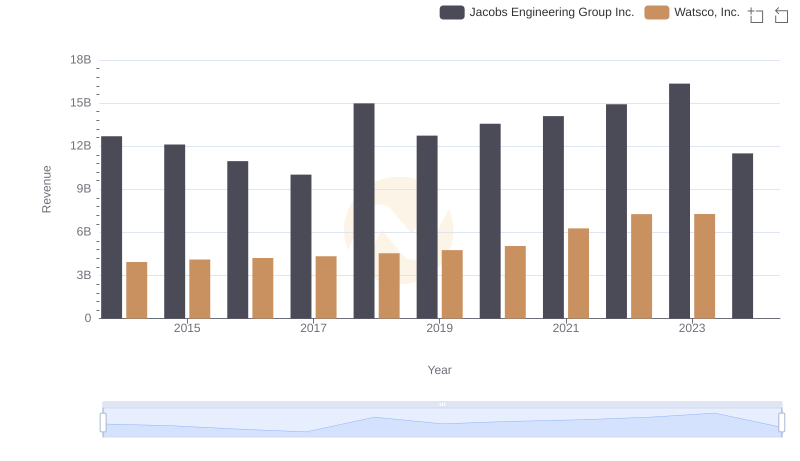
Breaking Down Revenue Trends: Watsco, Inc. vs Jacobs Engineering Group Inc.
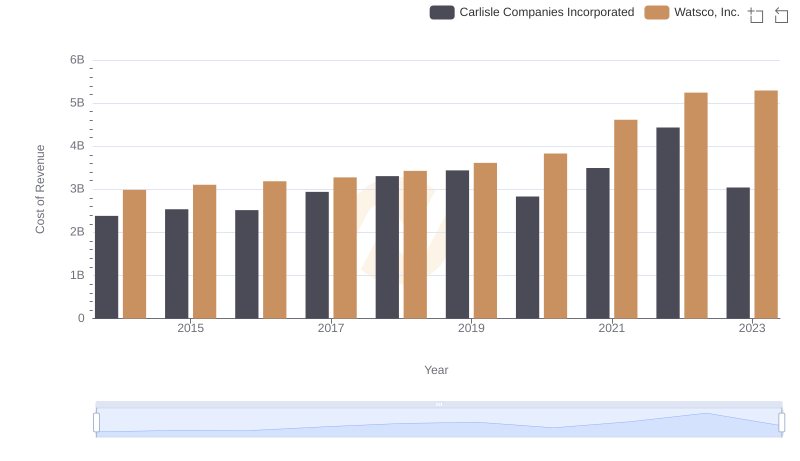
Cost Insights: Breaking Down Watsco, Inc. and Carlisle Companies Incorporated's Expenses
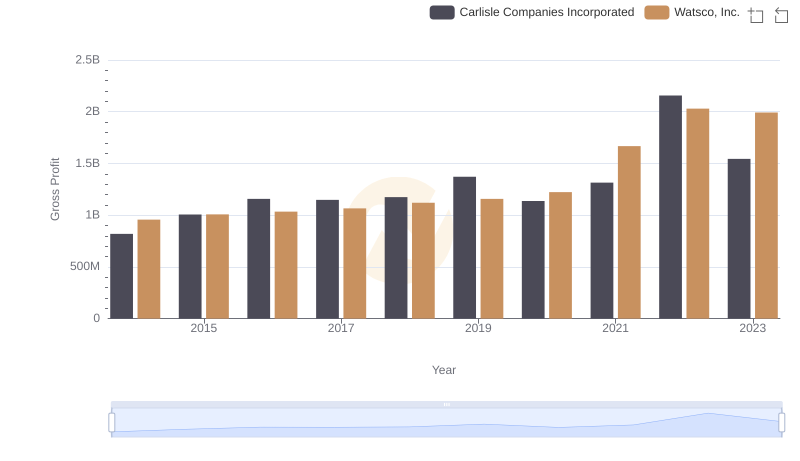
Key Insights on Gross Profit: Watsco, Inc. vs Carlisle Companies Incorporated
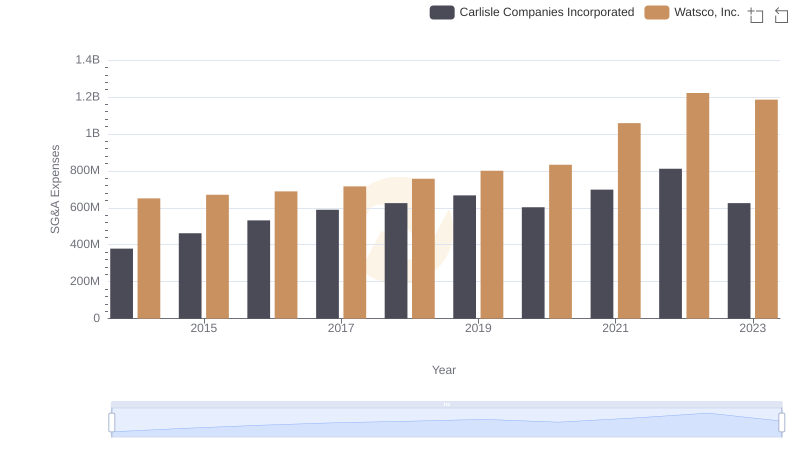
Watsco, Inc. and Carlisle Companies Incorporated: SG&A Spending Patterns Compared
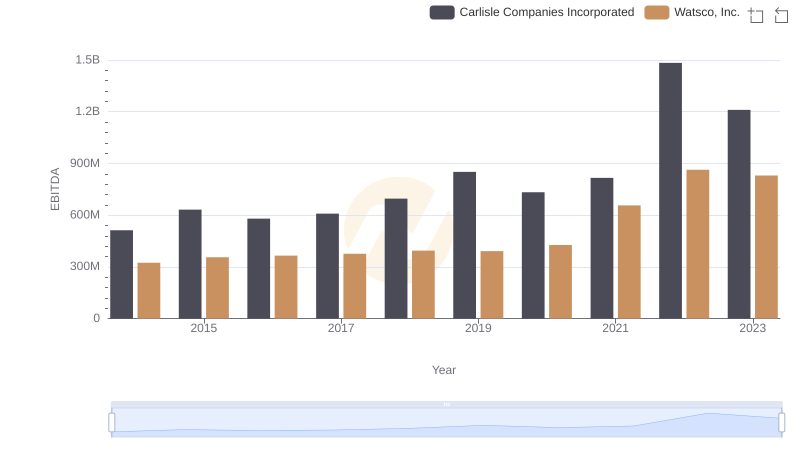
Watsco, Inc. and Carlisle Companies Incorporated: A Detailed Examination of EBITDA Performance