| __timestamp | Carlisle Companies Incorporated | Watsco, Inc. |
|---|---|---|
| Wednesday, January 1, 2014 | 512300000 | 323674000 |
| Thursday, January 1, 2015 | 631900000 | 355865000 |
| Friday, January 1, 2016 | 580200000 | 365698000 |
| Sunday, January 1, 2017 | 609300000 | 375907000 |
| Monday, January 1, 2018 | 696100000 | 394177000 |
| Tuesday, January 1, 2019 | 851000000 | 391396000 |
| Wednesday, January 1, 2020 | 733100000 | 426942000 |
| Friday, January 1, 2021 | 816100000 | 656655000 |
| Saturday, January 1, 2022 | 1483400000 | 863261000 |
| Sunday, January 1, 2023 | 1210700000 | 829900000 |
| Monday, January 1, 2024 | 1356800000 | 781775000 |
Unleashing insights
In the ever-evolving landscape of industrial and building products, Watsco, Inc. and Carlisle Companies Incorporated have emerged as key players. Over the past decade, these companies have demonstrated significant growth in their EBITDA, a crucial indicator of financial health. From 2014 to 2023, Carlisle Companies saw an impressive 136% increase in EBITDA, peaking in 2022. Meanwhile, Watsco, Inc. experienced a robust 157% growth, with its highest EBITDA recorded in 2022 as well.
This period of growth reflects strategic expansions and market adaptations, with both companies capitalizing on industry trends. Notably, Carlisle's EBITDA surged by 82% from 2020 to 2022, while Watsco's EBITDA grew by 102% in the same timeframe. These figures underscore the resilience and strategic foresight of these industry giants, setting a benchmark for competitors in the sector.
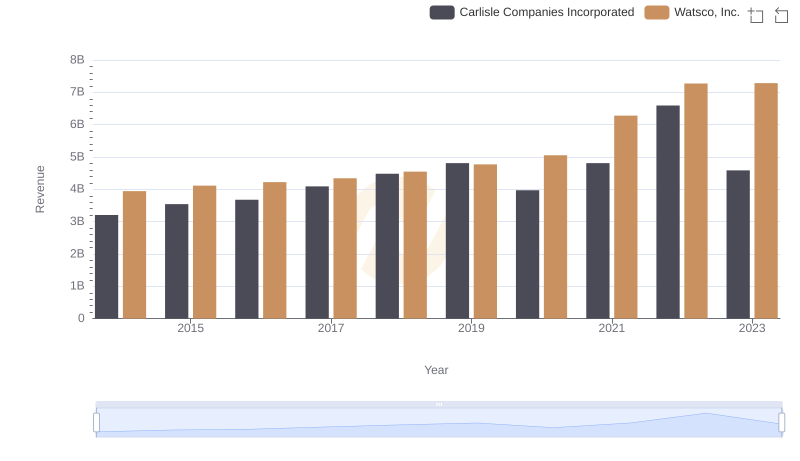
Annual Revenue Comparison: Watsco, Inc. vs Carlisle Companies Incorporated
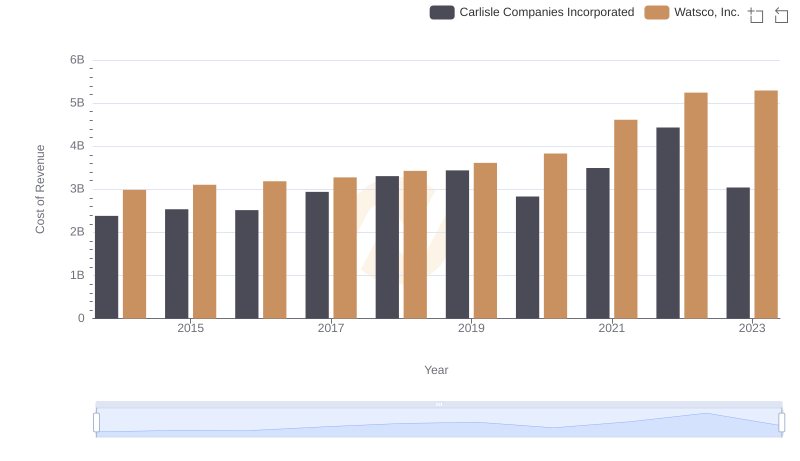
Cost Insights: Breaking Down Watsco, Inc. and Carlisle Companies Incorporated's Expenses
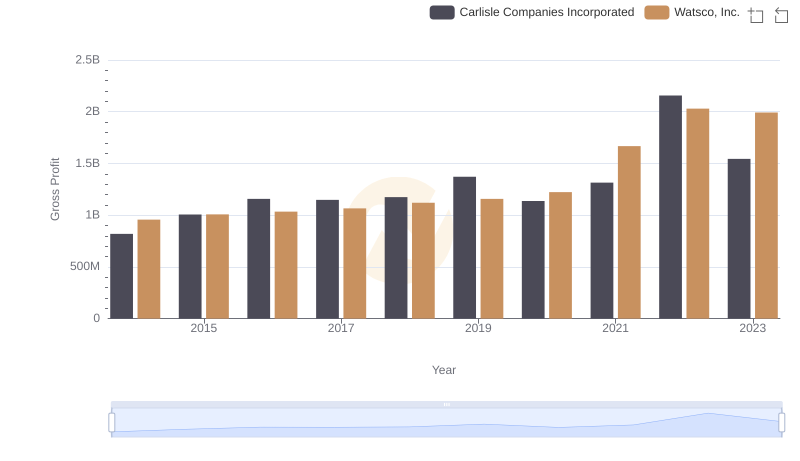
Key Insights on Gross Profit: Watsco, Inc. vs Carlisle Companies Incorporated
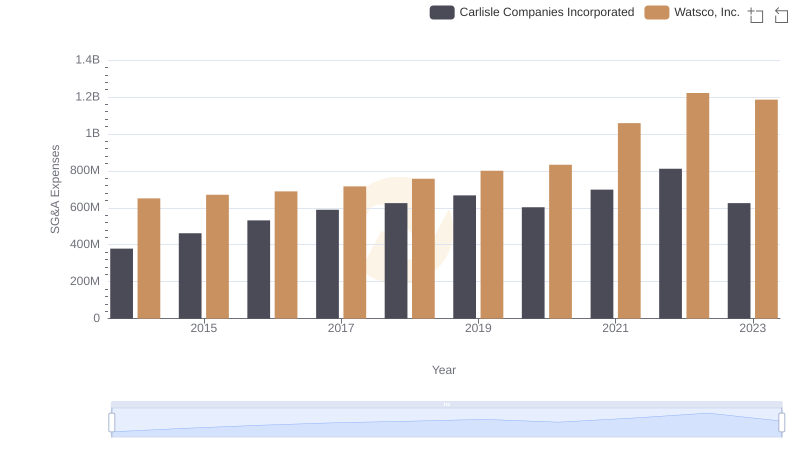
Watsco, Inc. and Carlisle Companies Incorporated: SG&A Spending Patterns Compared
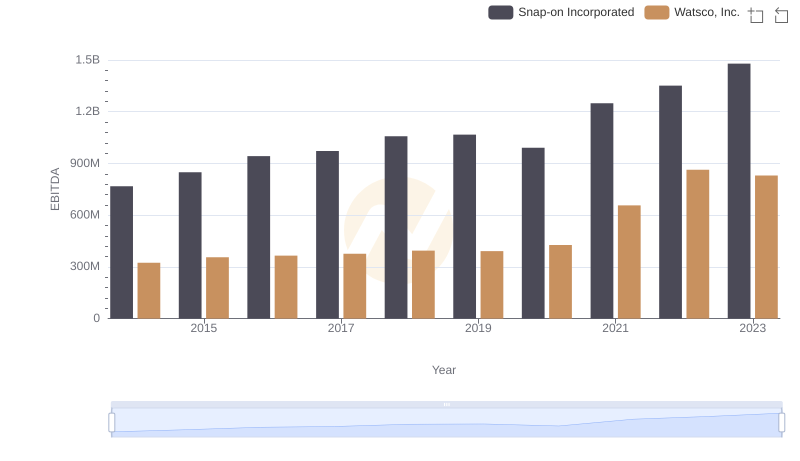
Comparative EBITDA Analysis: Watsco, Inc. vs Snap-on Incorporated
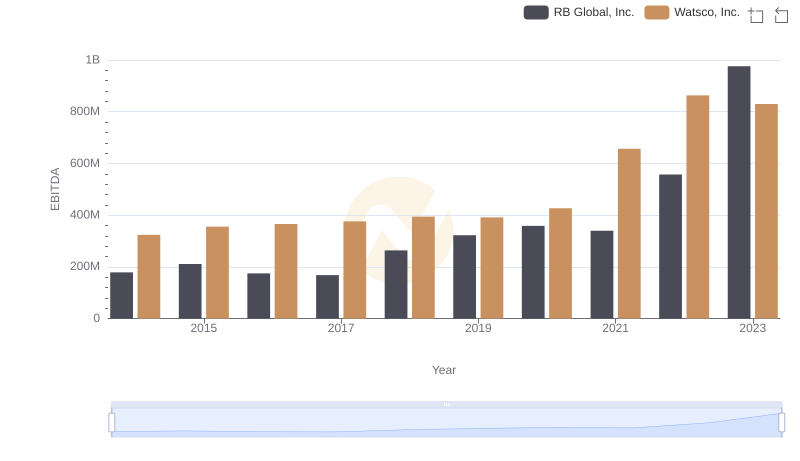
Comprehensive EBITDA Comparison: Watsco, Inc. vs RB Global, Inc.

Watsco, Inc. vs IDEX Corporation: In-Depth EBITDA Performance Comparison
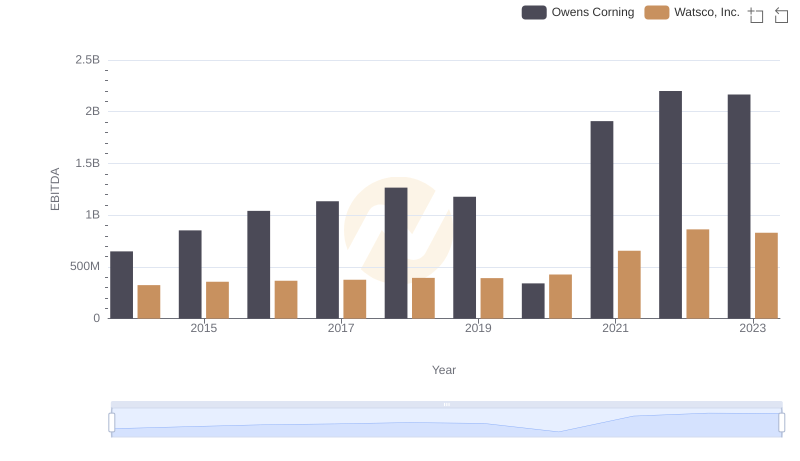
EBITDA Analysis: Evaluating Watsco, Inc. Against Owens Corning
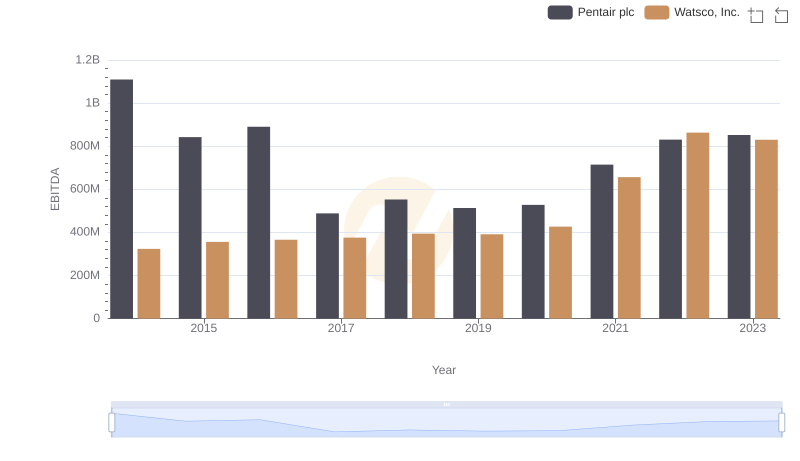
EBITDA Performance Review: Watsco, Inc. vs Pentair plc
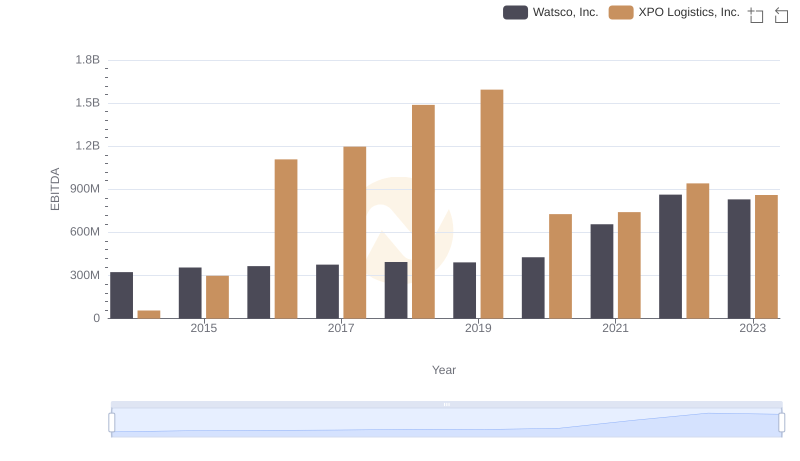
Comparative EBITDA Analysis: Watsco, Inc. vs XPO Logistics, Inc.
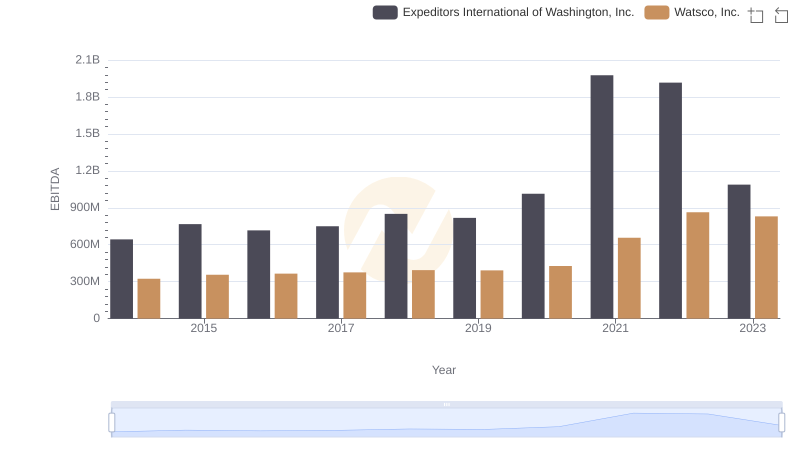
Comprehensive EBITDA Comparison: Watsco, Inc. vs Expeditors International of Washington, Inc.