| __timestamp | IDEX Corporation | Watsco, Inc. |
|---|---|---|
| Wednesday, January 1, 2014 | 1198452000 | 2988138000 |
| Thursday, January 1, 2015 | 1116353000 | 3105882000 |
| Friday, January 1, 2016 | 1182276000 | 3186118000 |
| Sunday, January 1, 2017 | 1260634000 | 3276296000 |
| Monday, January 1, 2018 | 1365771000 | 3426401000 |
| Tuesday, January 1, 2019 | 1369539000 | 3613406000 |
| Wednesday, January 1, 2020 | 1324222000 | 3832107000 |
| Friday, January 1, 2021 | 1540300000 | 4612647000 |
| Saturday, January 1, 2022 | 1755000000 | 5244055000 |
| Sunday, January 1, 2023 | 1825400000 | 5291627000 |
| Monday, January 1, 2024 | 1814000000 | 5573604000 |
Unlocking the unknown
In the ever-evolving landscape of industrial giants, understanding cost structures is pivotal. Over the past decade, Watsco, Inc. and IDEX Corporation have showcased intriguing trends in their cost of revenue. From 2014 to 2023, Watsco, Inc. consistently outpaced IDEX Corporation, with costs rising from approximately $3 billion to over $5 billion, marking a 77% increase. In contrast, IDEX Corporation's costs grew from around $1.2 billion to $1.8 billion, a 52% rise. This disparity highlights Watsco's expansive growth strategy, potentially driven by increased market demand and operational scaling. Meanwhile, IDEX's more conservative cost growth suggests a focus on efficiency and innovation. As we delve into these financial narratives, the data underscores the diverse strategies these corporations employ to navigate the competitive industrial sector.
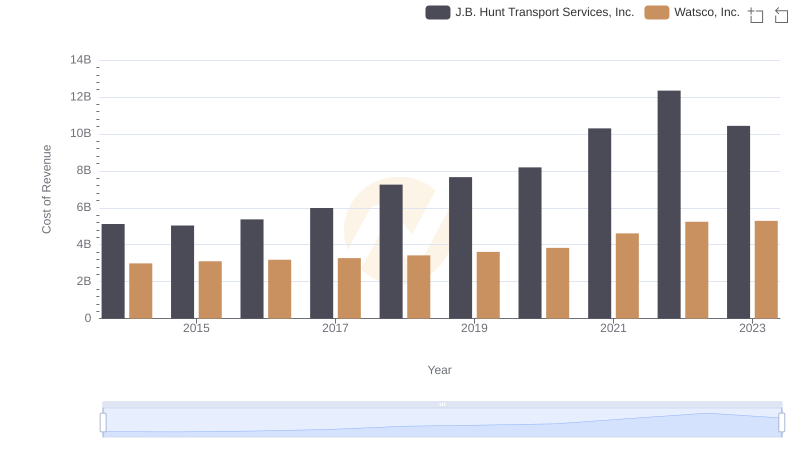
Cost Insights: Breaking Down Watsco, Inc. and J.B. Hunt Transport Services, Inc.'s Expenses
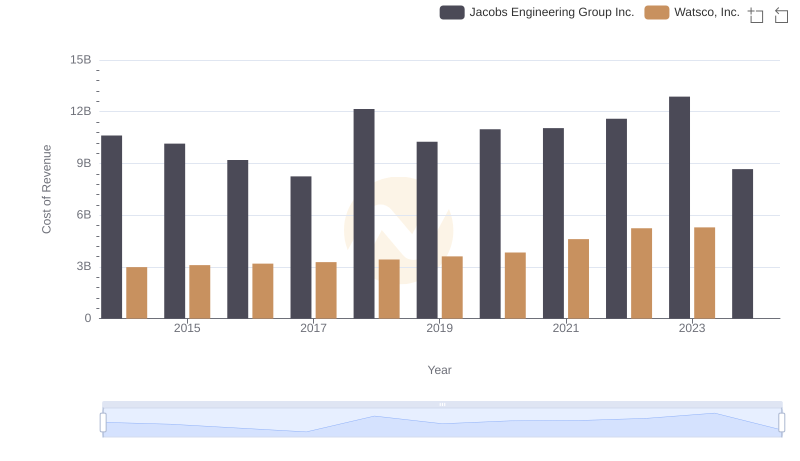
Cost of Revenue: Key Insights for Watsco, Inc. and Jacobs Engineering Group Inc.
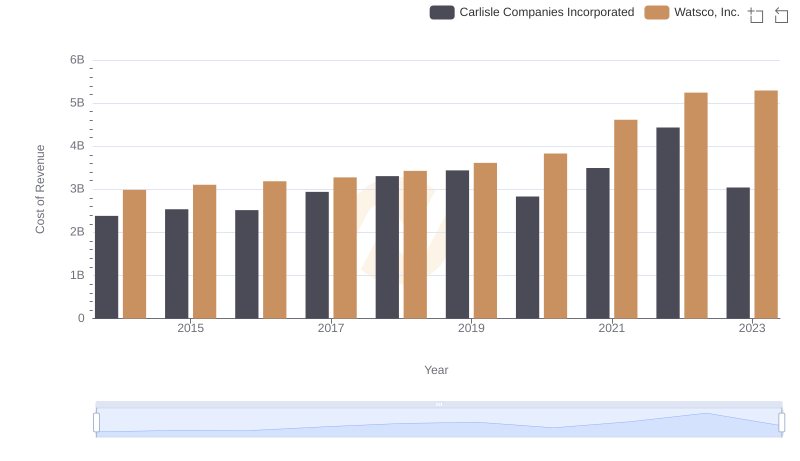
Cost Insights: Breaking Down Watsco, Inc. and Carlisle Companies Incorporated's Expenses
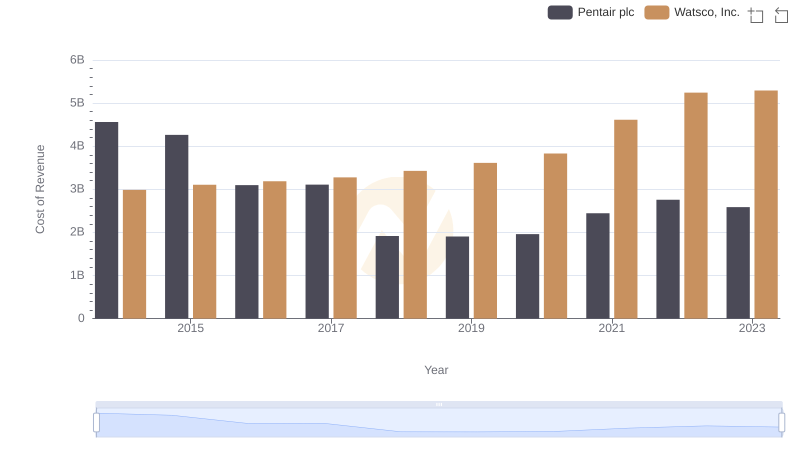
Cost of Revenue Trends: Watsco, Inc. vs Pentair plc
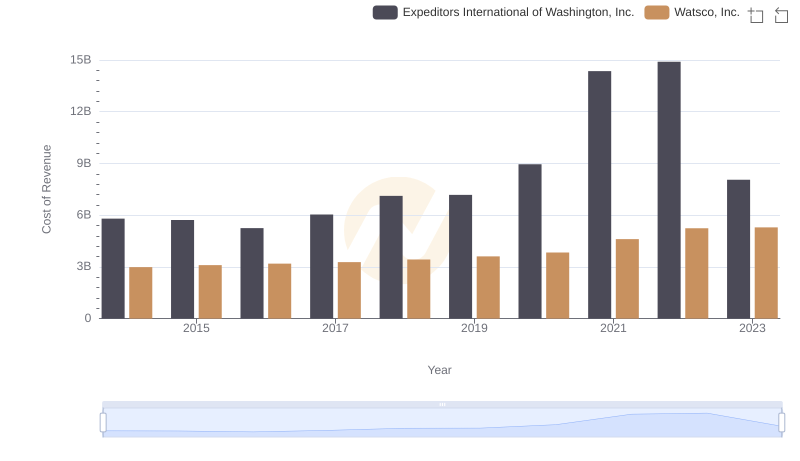
Cost of Revenue: Key Insights for Watsco, Inc. and Expeditors International of Washington, Inc.
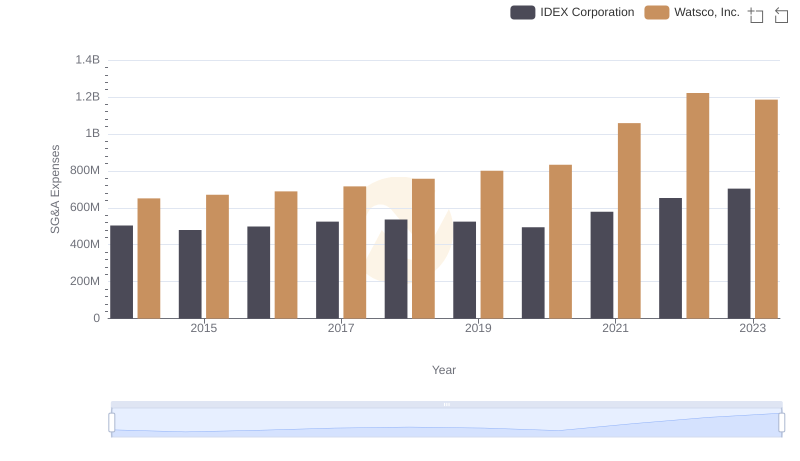
Comparing SG&A Expenses: Watsco, Inc. vs IDEX Corporation Trends and Insights

Watsco, Inc. vs IDEX Corporation: In-Depth EBITDA Performance Comparison