| __timestamp | Southwest Airlines Co. | Waste Management, Inc. |
|---|---|---|
| Wednesday, January 1, 2014 | 14049000000 | 9002000000 |
| Thursday, January 1, 2015 | 13423000000 | 8231000000 |
| Friday, January 1, 2016 | 14151000000 | 8486000000 |
| Sunday, January 1, 2017 | 14968000000 | 9021000000 |
| Monday, January 1, 2018 | 15907000000 | 9249000000 |
| Tuesday, January 1, 2019 | 16445000000 | 9496000000 |
| Wednesday, January 1, 2020 | 10938000000 | 9341000000 |
| Friday, January 1, 2021 | 11675000000 | 11111000000 |
| Saturday, January 1, 2022 | 19062000000 | 12294000000 |
| Sunday, January 1, 2023 | 21868000000 | 12606000000 |
| Monday, January 1, 2024 | 23024000000 | 13383000000 |
Cracking the code
In the ever-evolving landscape of American business, Waste Management, Inc. and Southwest Airlines Co. stand as titans in their respective fields. From 2014 to 2023, these companies have navigated economic shifts, technological advancements, and global challenges, all reflected in their cost of revenue trends.
Southwest Airlines Co. has seen a remarkable 56% increase in its cost of revenue over the past decade, peaking in 2023. This surge underscores the airline industry's resilience and adaptability, especially in the face of unprecedented challenges like the COVID-19 pandemic.
Conversely, Waste Management, Inc. has experienced a steadier growth, with a 40% rise in cost of revenue. This reflects the consistent demand for waste management services, even during economic downturns.
These trends highlight the contrasting dynamics of the airline and waste management sectors, offering valuable insights for investors and industry analysts alike.
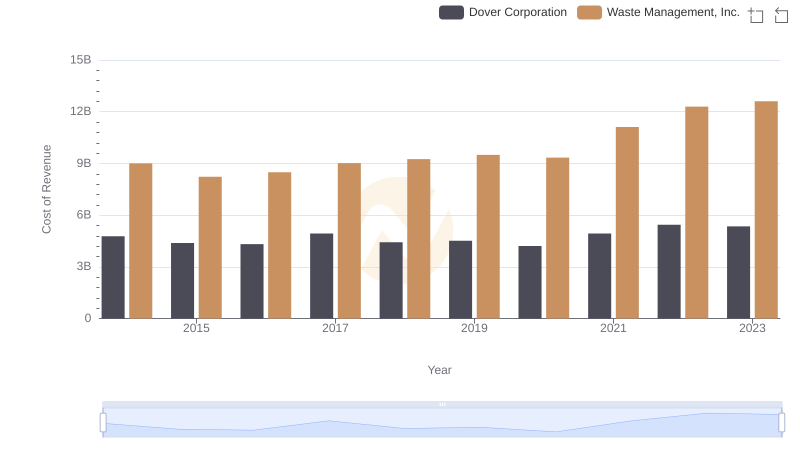
Comparing Cost of Revenue Efficiency: Waste Management, Inc. vs Dover Corporation
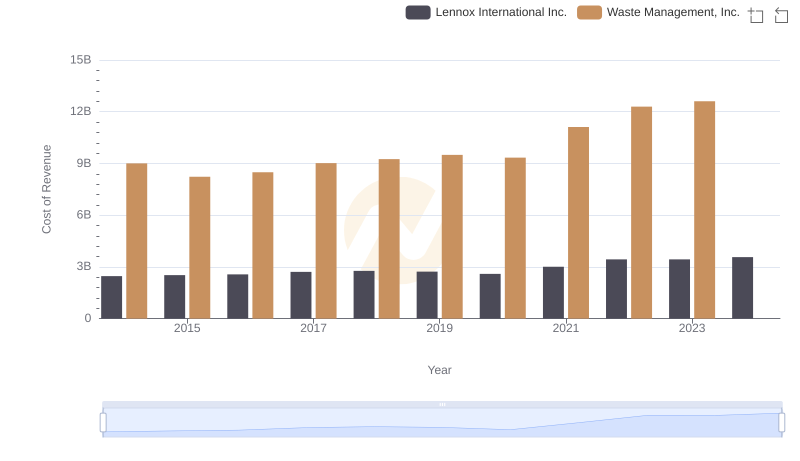
Cost Insights: Breaking Down Waste Management, Inc. and Lennox International Inc.'s Expenses
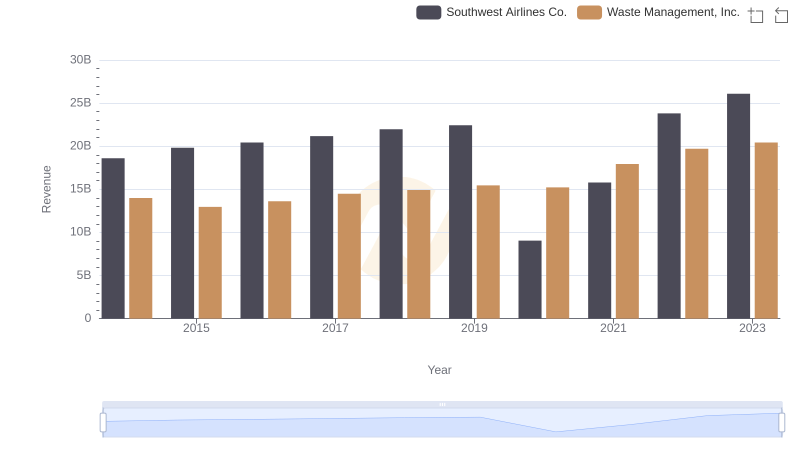
Revenue Insights: Waste Management, Inc. and Southwest Airlines Co. Performance Compared
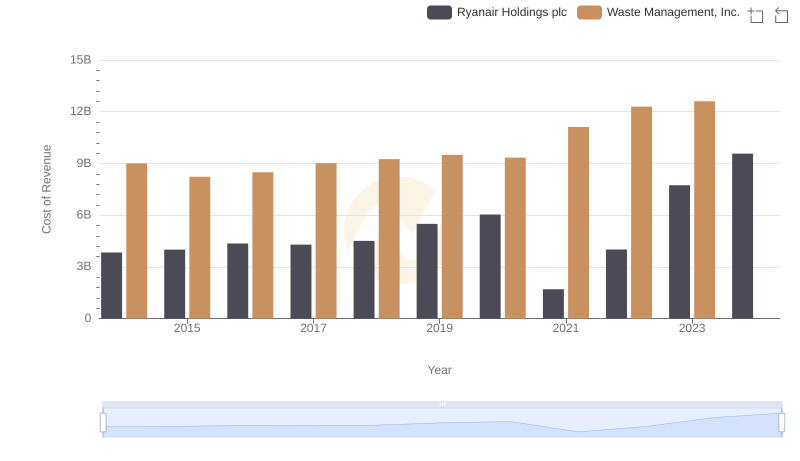
Cost Insights: Breaking Down Waste Management, Inc. and Ryanair Holdings plc's Expenses
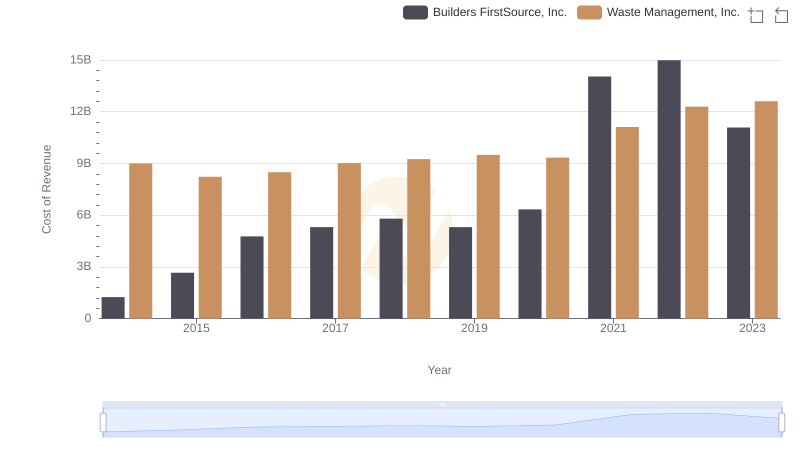
Cost Insights: Breaking Down Waste Management, Inc. and Builders FirstSource, Inc.'s Expenses
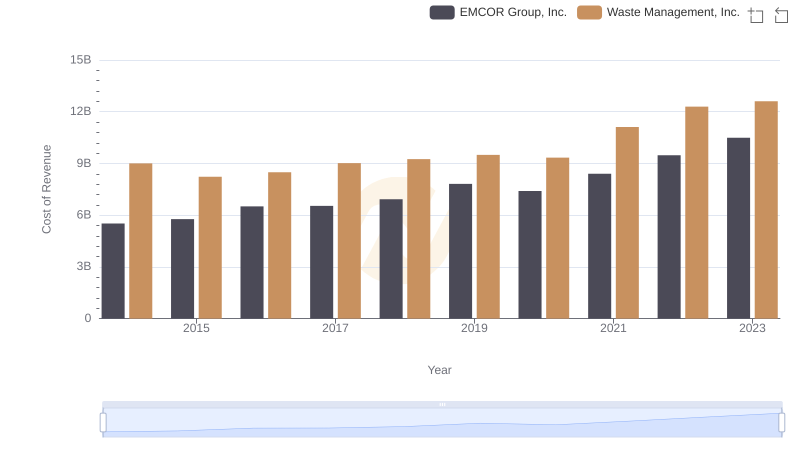
Cost Insights: Breaking Down Waste Management, Inc. and EMCOR Group, Inc.'s Expenses
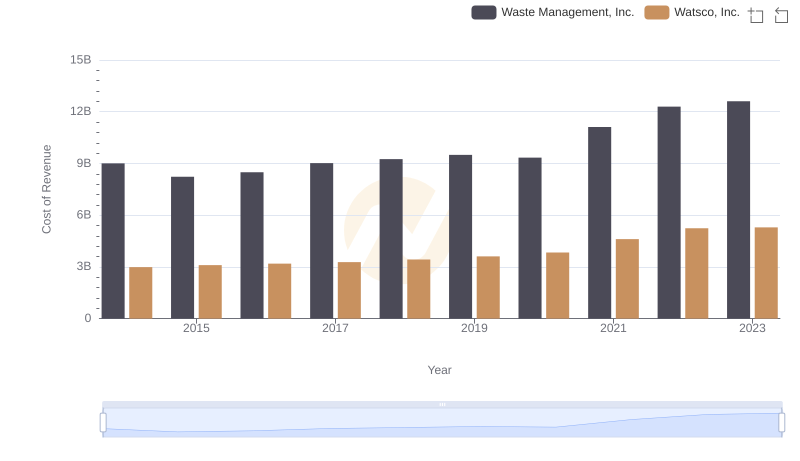
Cost of Revenue Comparison: Waste Management, Inc. vs Watsco, Inc.
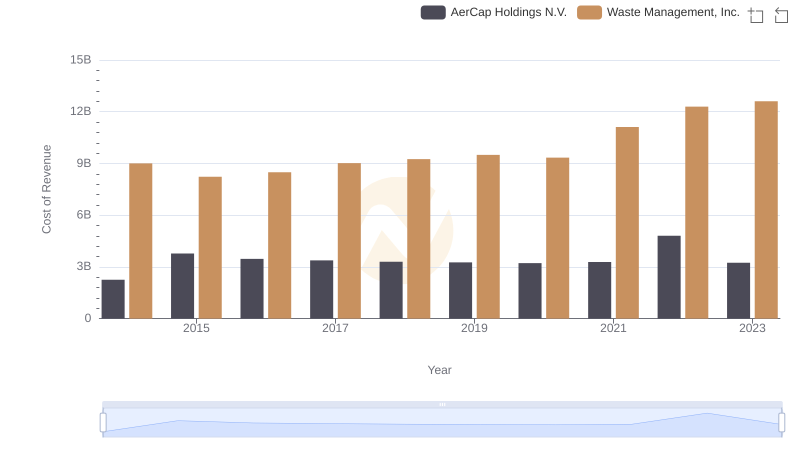
Cost of Revenue: Key Insights for Waste Management, Inc. and AerCap Holdings N.V.
Analyzing Cost of Revenue: Waste Management, Inc. and TransUnion