| __timestamp | EMCOR Group, Inc. | Waste Management, Inc. |
|---|---|---|
| Wednesday, January 1, 2014 | 5517719000 | 9002000000 |
| Thursday, January 1, 2015 | 5774247000 | 8231000000 |
| Friday, January 1, 2016 | 6513662000 | 8486000000 |
| Sunday, January 1, 2017 | 6539987000 | 9021000000 |
| Monday, January 1, 2018 | 6925178000 | 9249000000 |
| Tuesday, January 1, 2019 | 7818743000 | 9496000000 |
| Wednesday, January 1, 2020 | 7401679000 | 9341000000 |
| Friday, January 1, 2021 | 8401843000 | 11111000000 |
| Saturday, January 1, 2022 | 9472526000 | 12294000000 |
| Sunday, January 1, 2023 | 10493534000 | 12606000000 |
| Monday, January 1, 2024 | 13383000000 |
Data in motion
In the ever-evolving landscape of corporate expenses, understanding cost structures is pivotal. Waste Management, Inc. and EMCOR Group, Inc. have shown intriguing trends over the past decade. From 2014 to 2023, Waste Management's cost of revenue surged by approximately 40%, peaking at $12.6 billion in 2023. Meanwhile, EMCOR Group's expenses grew by nearly 90%, reaching $10.5 billion in the same year. This growth reflects the companies' strategic expansions and operational efficiencies.
Waste Management consistently outpaced EMCOR in cost of revenue, maintaining a lead of about 20% on average. However, EMCOR's rapid growth trajectory suggests a robust adaptation to market demands. These insights not only highlight the financial dynamics of these industry giants but also underscore the importance of strategic cost management in maintaining competitive advantage.
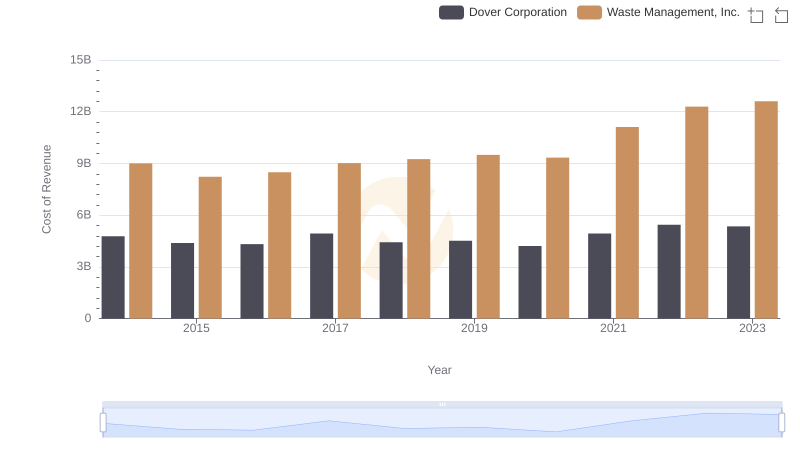
Comparing Cost of Revenue Efficiency: Waste Management, Inc. vs Dover Corporation
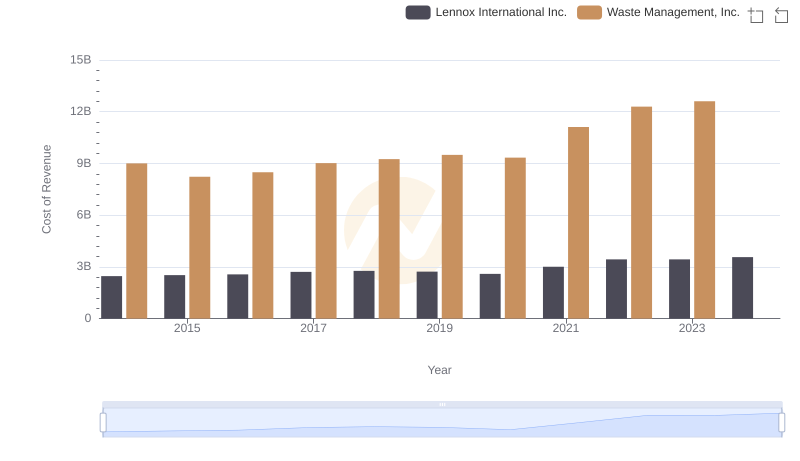
Cost Insights: Breaking Down Waste Management, Inc. and Lennox International Inc.'s Expenses
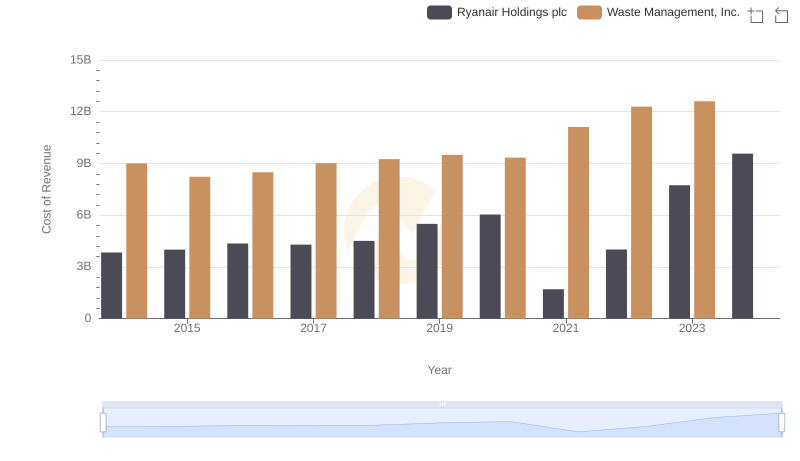
Cost Insights: Breaking Down Waste Management, Inc. and Ryanair Holdings plc's Expenses
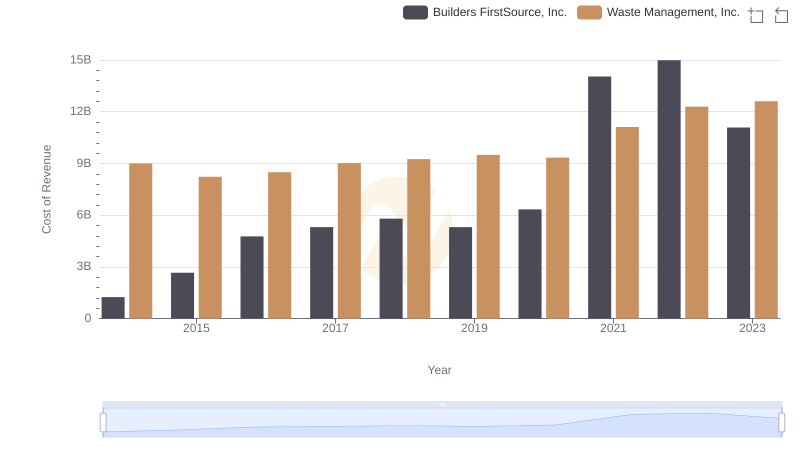
Cost Insights: Breaking Down Waste Management, Inc. and Builders FirstSource, Inc.'s Expenses
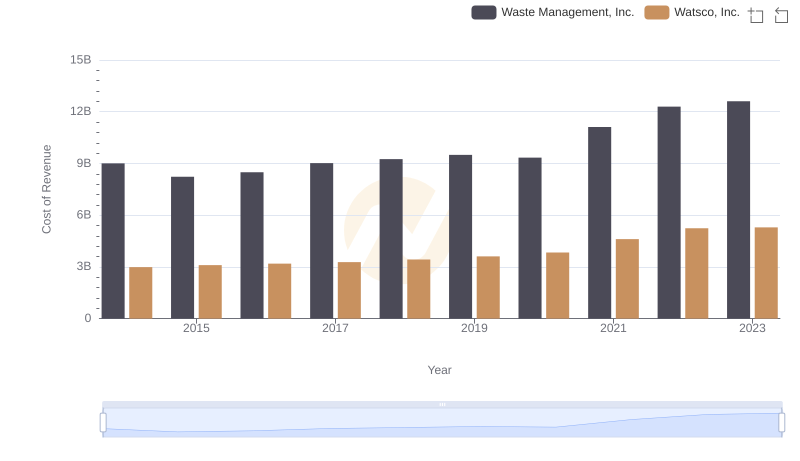
Cost of Revenue Comparison: Waste Management, Inc. vs Watsco, Inc.
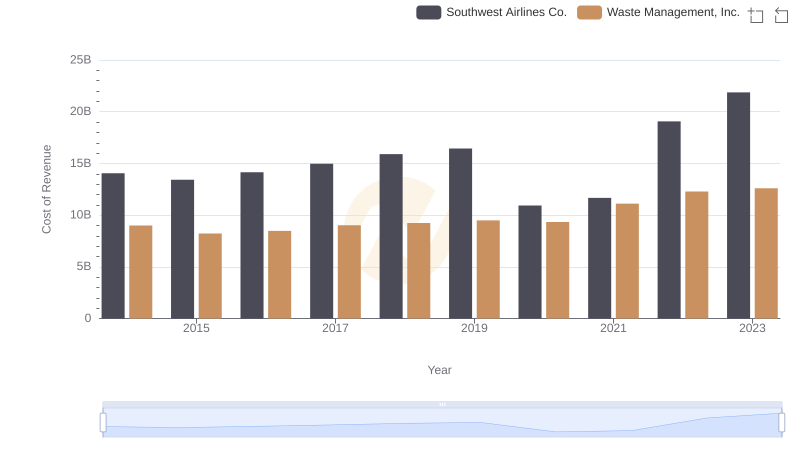
Cost of Revenue Comparison: Waste Management, Inc. vs Southwest Airlines Co.
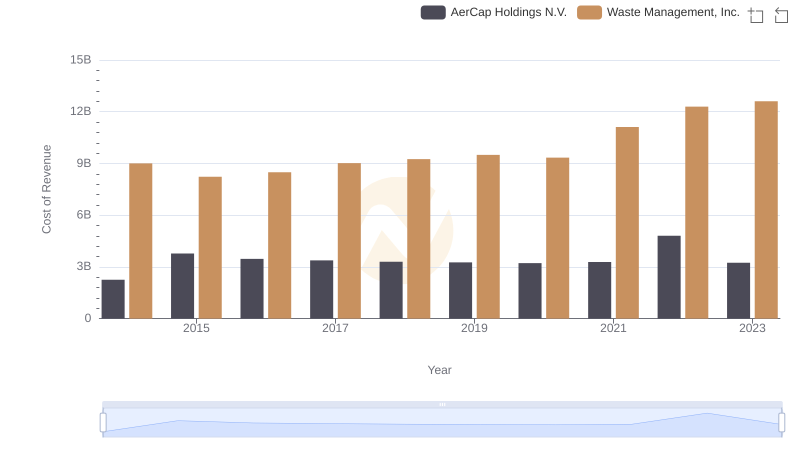
Cost of Revenue: Key Insights for Waste Management, Inc. and AerCap Holdings N.V.
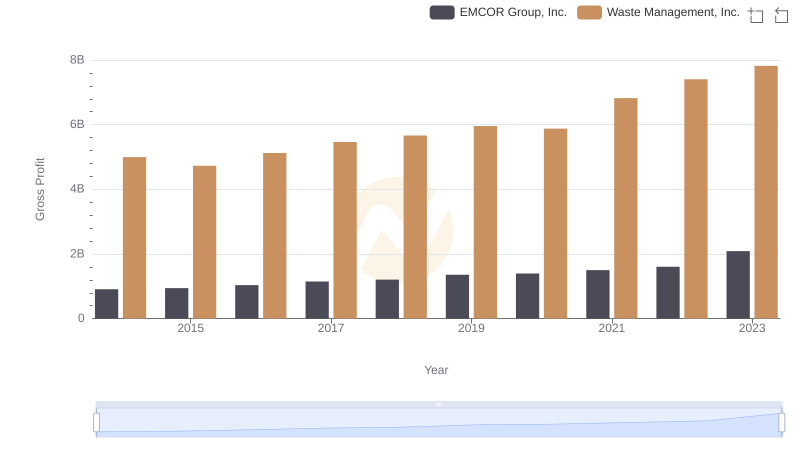
Gross Profit Analysis: Comparing Waste Management, Inc. and EMCOR Group, Inc.
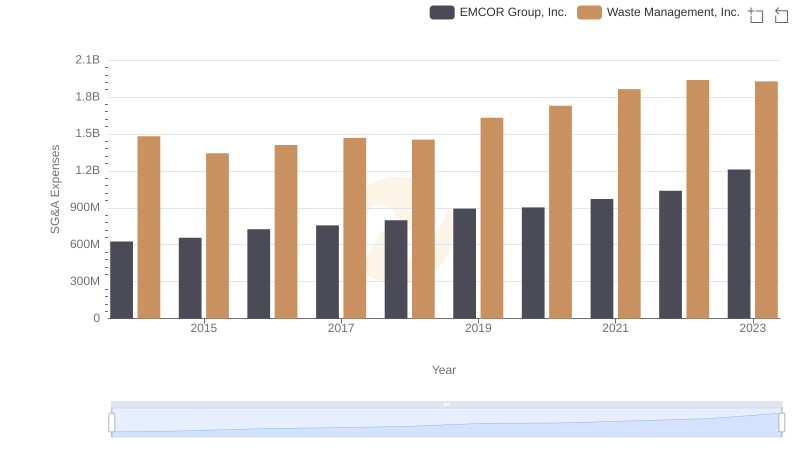
Waste Management, Inc. and EMCOR Group, Inc.: SG&A Spending Patterns Compared
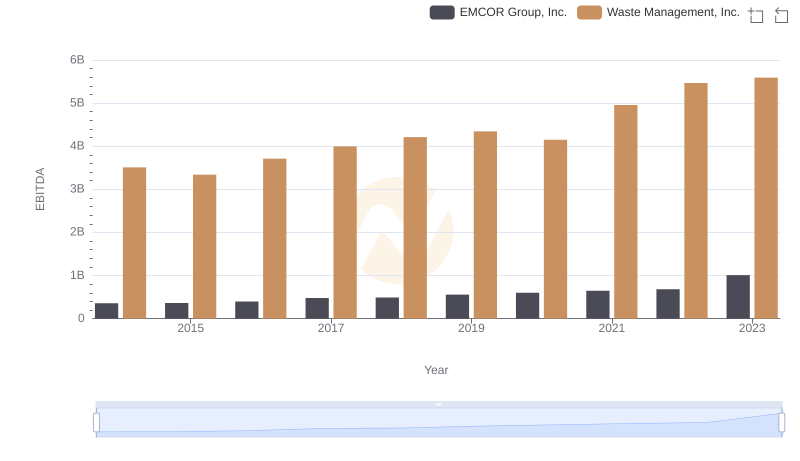
Comprehensive EBITDA Comparison: Waste Management, Inc. vs EMCOR Group, Inc.