| __timestamp | Builders FirstSource, Inc. | Waste Management, Inc. |
|---|---|---|
| Wednesday, January 1, 2014 | 1247099000 | 9002000000 |
| Thursday, January 1, 2015 | 2662967000 | 8231000000 |
| Friday, January 1, 2016 | 4770536000 | 8486000000 |
| Sunday, January 1, 2017 | 5306818000 | 9021000000 |
| Monday, January 1, 2018 | 5801831000 | 9249000000 |
| Tuesday, January 1, 2019 | 5303602000 | 9496000000 |
| Wednesday, January 1, 2020 | 6336290000 | 9341000000 |
| Friday, January 1, 2021 | 14042900000 | 11111000000 |
| Saturday, January 1, 2022 | 14982039000 | 12294000000 |
| Sunday, January 1, 2023 | 11084996000 | 12606000000 |
| Monday, January 1, 2024 | 13383000000 |
Data in motion
In the ever-evolving landscape of corporate expenses, understanding cost structures is pivotal. Over the past decade, Waste Management, Inc. and Builders FirstSource, Inc. have showcased intriguing trends in their cost of revenue. From 2014 to 2023, Builders FirstSource experienced a staggering 800% increase in costs, peaking in 2022. This surge reflects the company's aggressive expansion and market adaptation strategies. Meanwhile, Waste Management's costs grew by approximately 40%, indicating a more stable yet steadily increasing expense pattern. Notably, 2023 marked a slight decline for Builders FirstSource, hinting at potential efficiency improvements or market adjustments. These insights not only highlight the companies' operational strategies but also offer a window into broader industry trends. As businesses navigate economic shifts, understanding these cost dynamics becomes essential for stakeholders and investors alike.
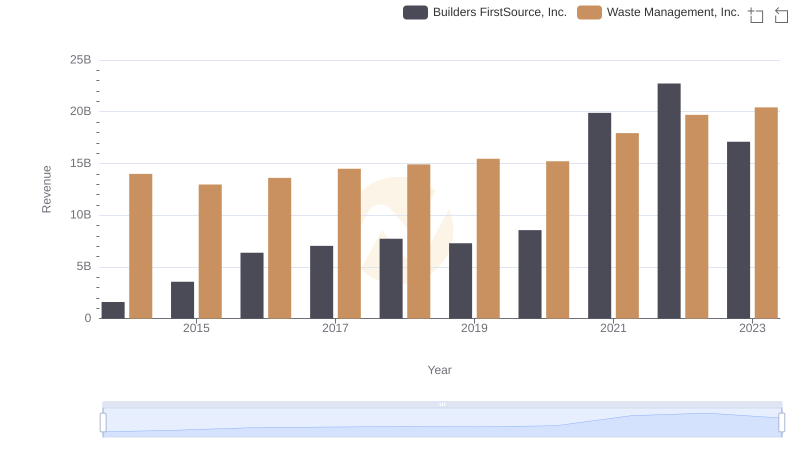
Breaking Down Revenue Trends: Waste Management, Inc. vs Builders FirstSource, Inc.
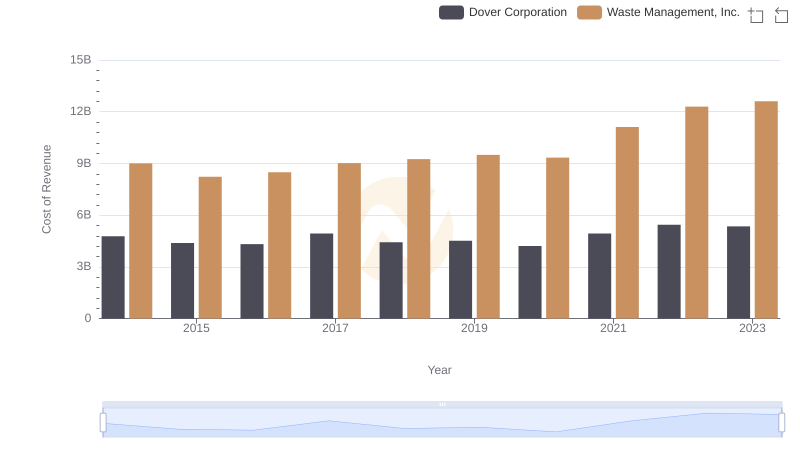
Comparing Cost of Revenue Efficiency: Waste Management, Inc. vs Dover Corporation
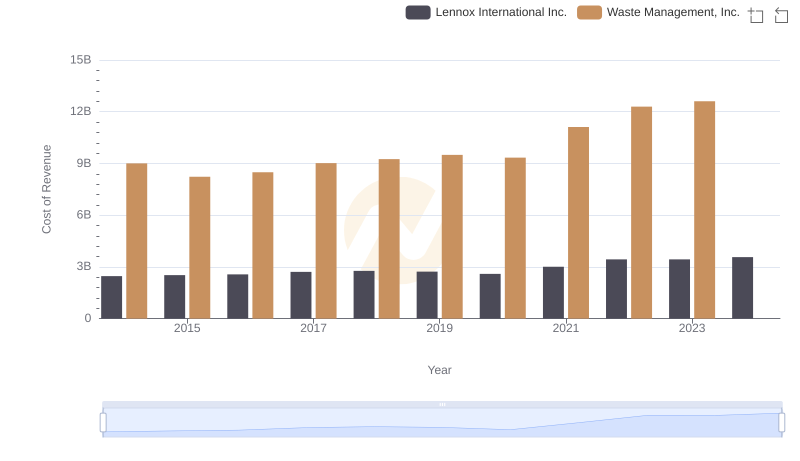
Cost Insights: Breaking Down Waste Management, Inc. and Lennox International Inc.'s Expenses
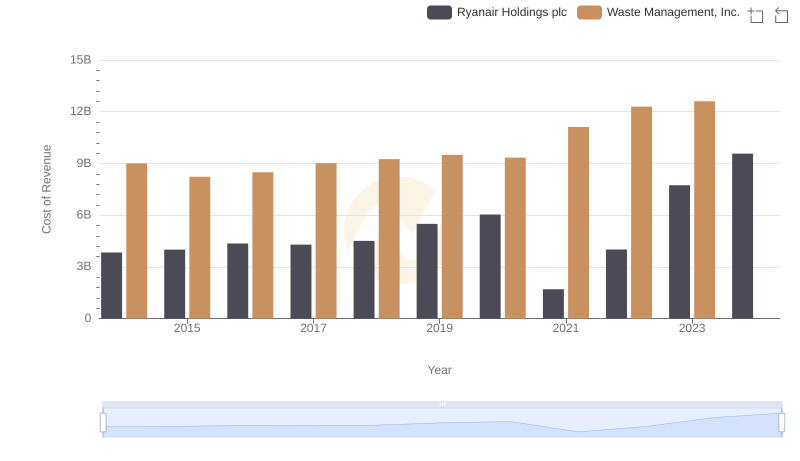
Cost Insights: Breaking Down Waste Management, Inc. and Ryanair Holdings plc's Expenses
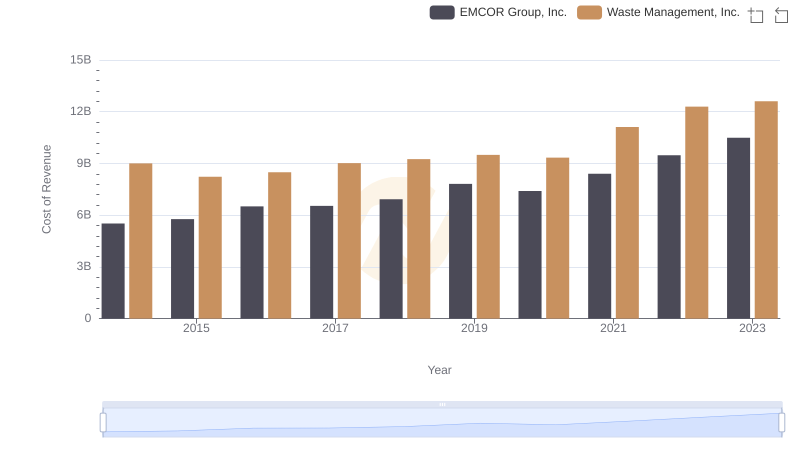
Cost Insights: Breaking Down Waste Management, Inc. and EMCOR Group, Inc.'s Expenses
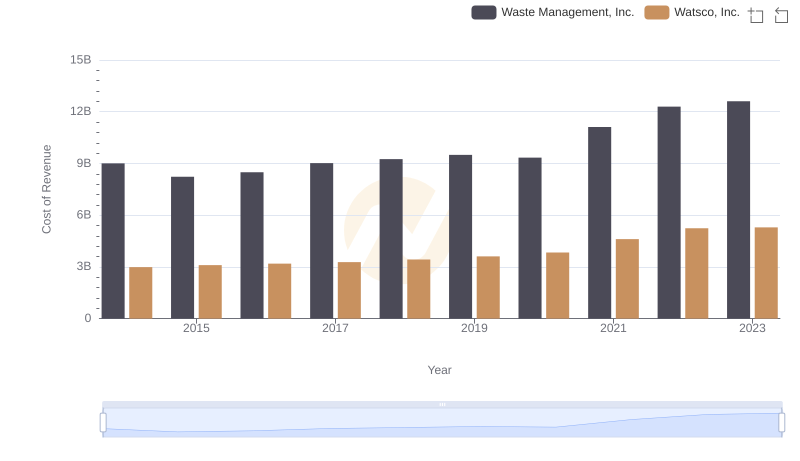
Cost of Revenue Comparison: Waste Management, Inc. vs Watsco, Inc.
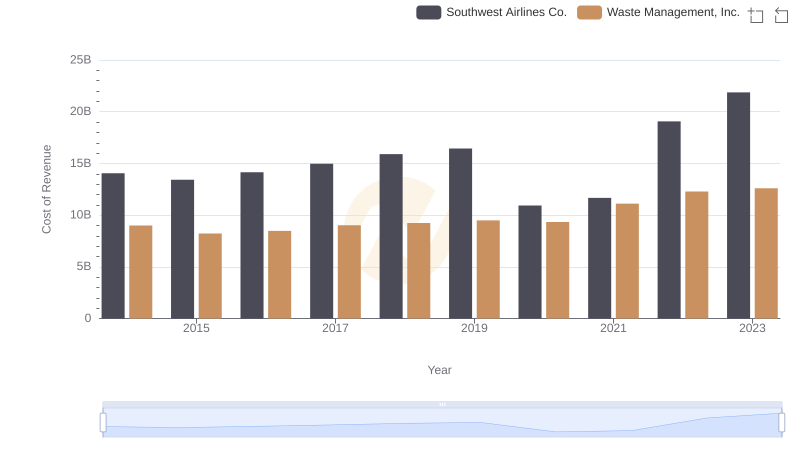
Cost of Revenue Comparison: Waste Management, Inc. vs Southwest Airlines Co.
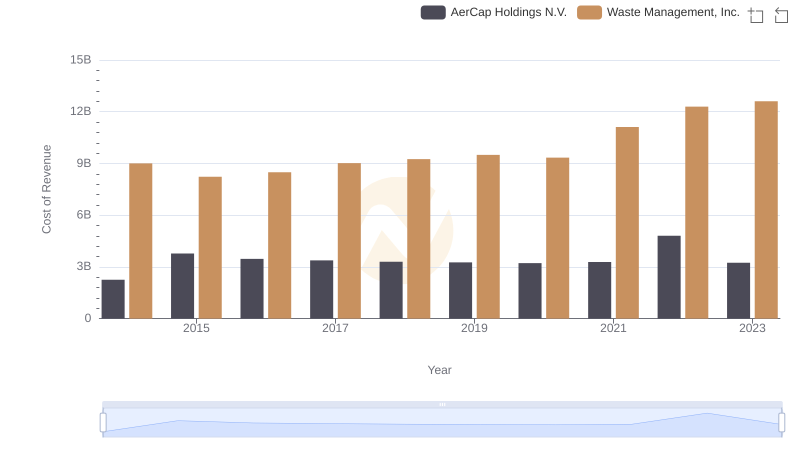
Cost of Revenue: Key Insights for Waste Management, Inc. and AerCap Holdings N.V.
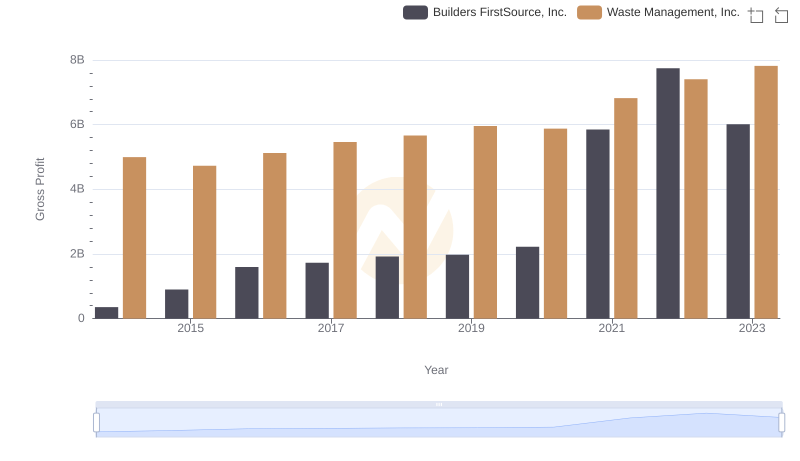
Gross Profit Comparison: Waste Management, Inc. and Builders FirstSource, Inc. Trends
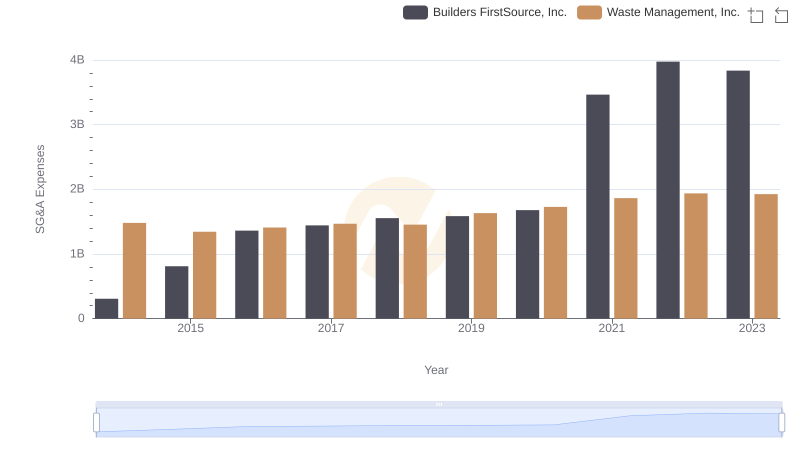
Who Optimizes SG&A Costs Better? Waste Management, Inc. or Builders FirstSource, Inc.
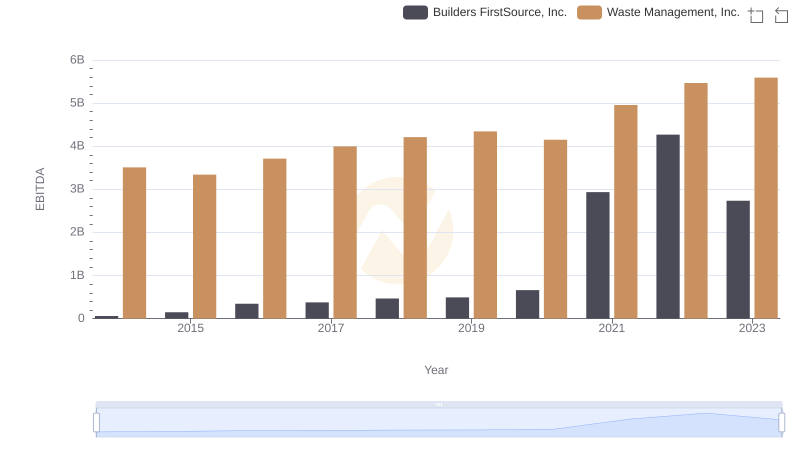
EBITDA Performance Review: Waste Management, Inc. vs Builders FirstSource, Inc.