| __timestamp | Waste Management, Inc. | Watsco, Inc. |
|---|---|---|
| Wednesday, January 1, 2014 | 9002000000 | 2988138000 |
| Thursday, January 1, 2015 | 8231000000 | 3105882000 |
| Friday, January 1, 2016 | 8486000000 | 3186118000 |
| Sunday, January 1, 2017 | 9021000000 | 3276296000 |
| Monday, January 1, 2018 | 9249000000 | 3426401000 |
| Tuesday, January 1, 2019 | 9496000000 | 3613406000 |
| Wednesday, January 1, 2020 | 9341000000 | 3832107000 |
| Friday, January 1, 2021 | 11111000000 | 4612647000 |
| Saturday, January 1, 2022 | 12294000000 | 5244055000 |
| Sunday, January 1, 2023 | 12606000000 | 5291627000 |
| Monday, January 1, 2024 | 13383000000 | 5573604000 |
Unleashing the power of data
In the ever-evolving landscape of corporate finance, understanding cost structures is pivotal. Over the past decade, Waste Management, Inc. and Watsco, Inc. have showcased intriguing trends in their cost of revenue. Waste Management, Inc., a leader in waste services, has seen its cost of revenue grow by approximately 40% from 2014 to 2023, peaking at $12.6 billion in 2023. This reflects the company's expanding operations and increased service demand. Meanwhile, Watsco, Inc., a major player in HVAC distribution, experienced a 77% rise in its cost of revenue, reaching $5.3 billion in 2023. This surge underscores the growing demand for climate control solutions. The data highlights how both companies have navigated economic shifts, with Waste Management maintaining a larger cost base, indicative of its broader operational scale. These insights offer a window into strategic financial management in distinct yet essential industries.
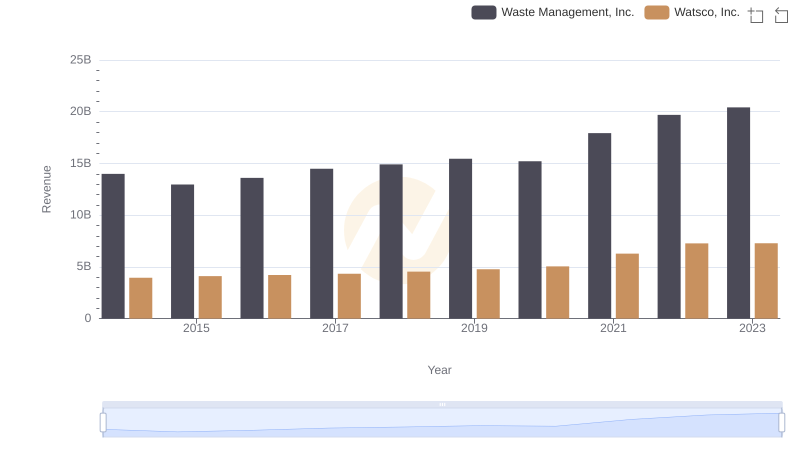
Revenue Showdown: Waste Management, Inc. vs Watsco, Inc.
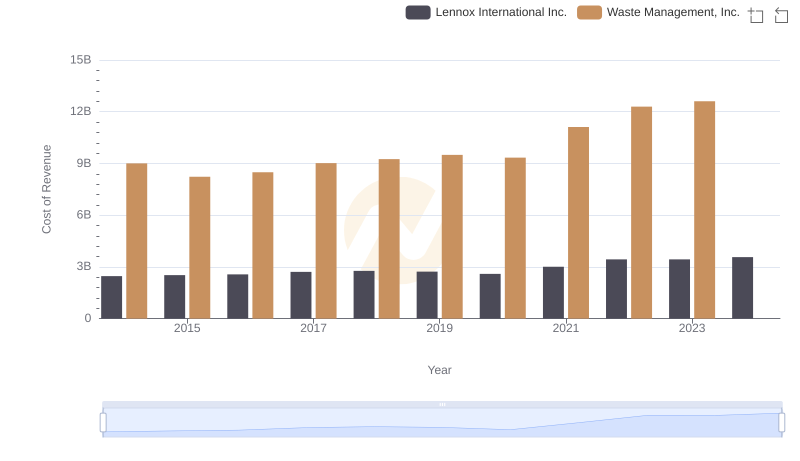
Cost Insights: Breaking Down Waste Management, Inc. and Lennox International Inc.'s Expenses
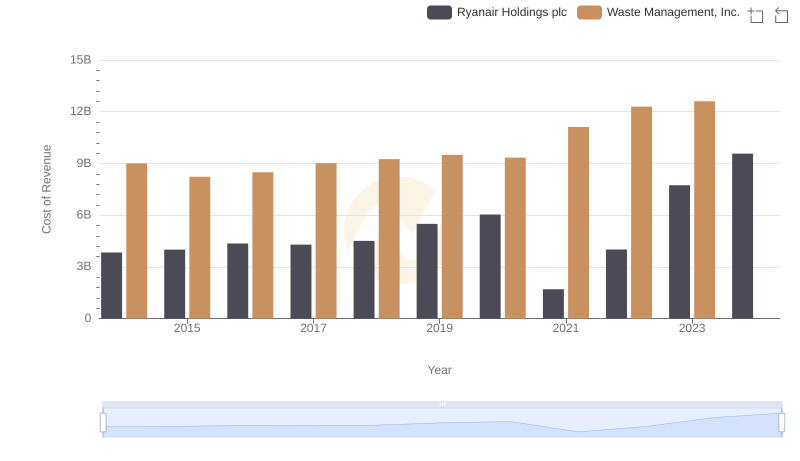
Cost Insights: Breaking Down Waste Management, Inc. and Ryanair Holdings plc's Expenses
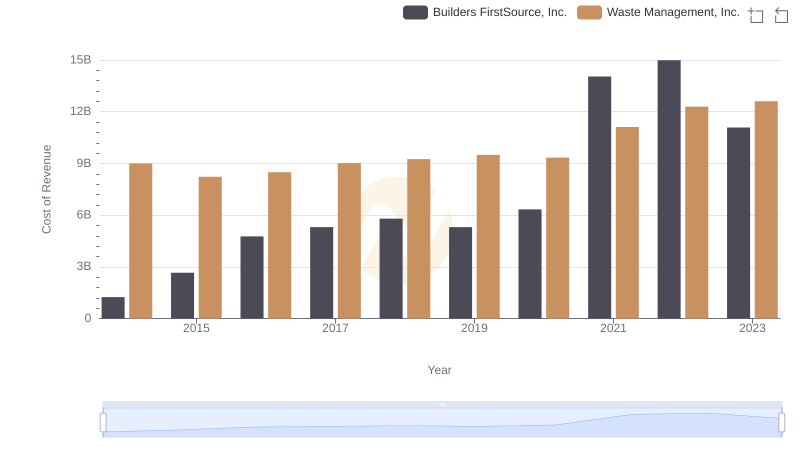
Cost Insights: Breaking Down Waste Management, Inc. and Builders FirstSource, Inc.'s Expenses
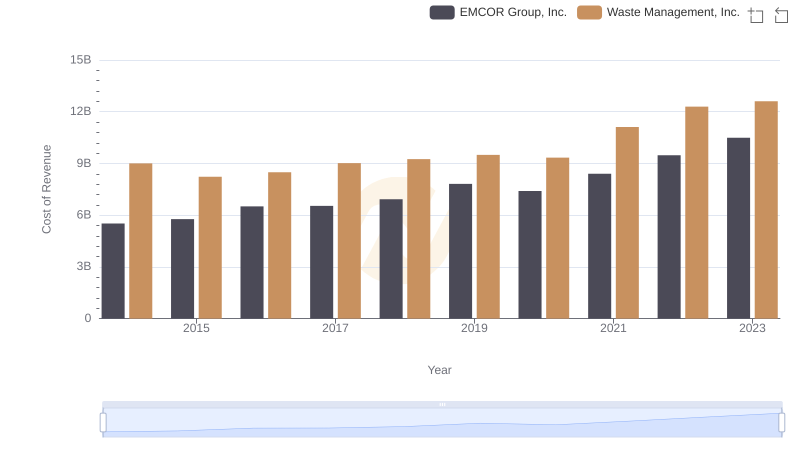
Cost Insights: Breaking Down Waste Management, Inc. and EMCOR Group, Inc.'s Expenses
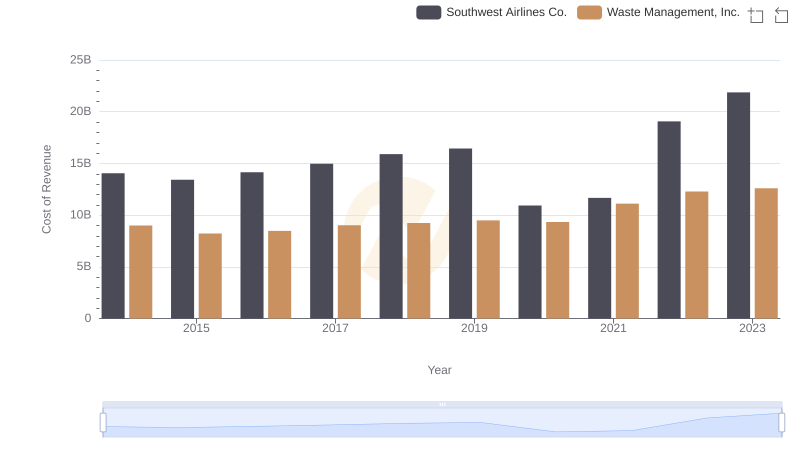
Cost of Revenue Comparison: Waste Management, Inc. vs Southwest Airlines Co.
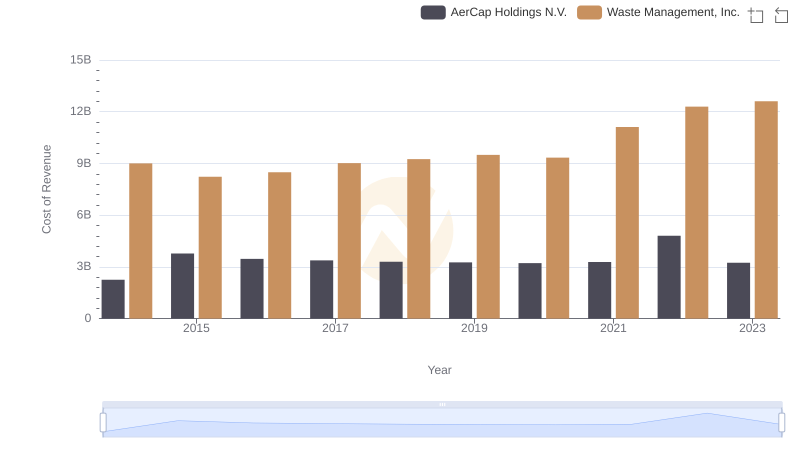
Cost of Revenue: Key Insights for Waste Management, Inc. and AerCap Holdings N.V.
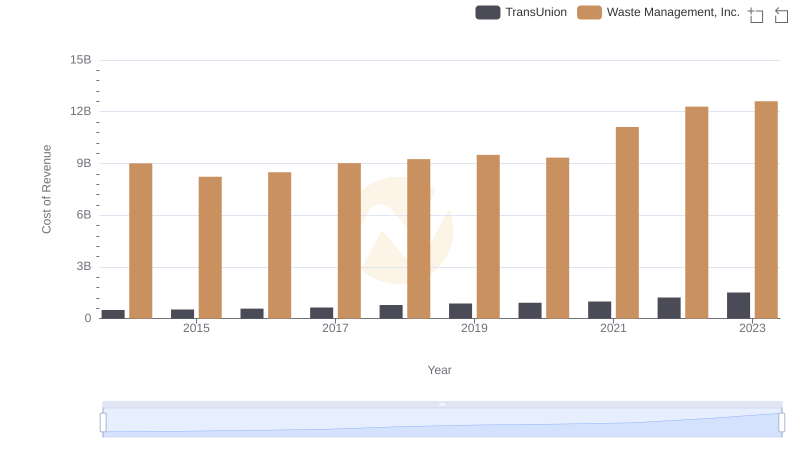
Analyzing Cost of Revenue: Waste Management, Inc. and TransUnion
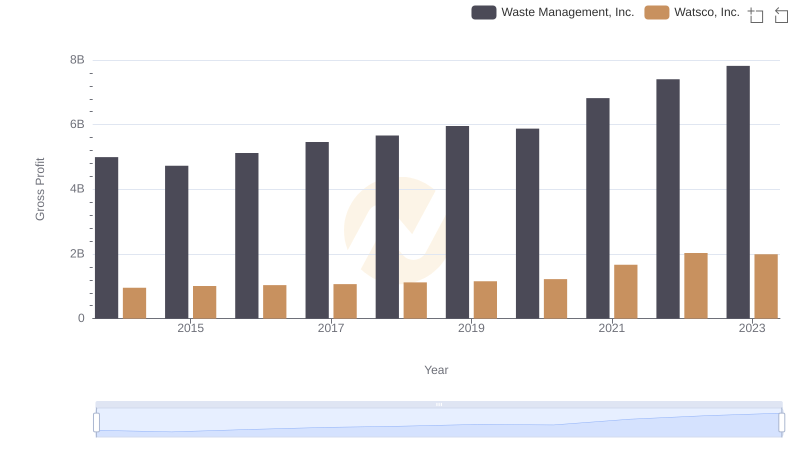
Who Generates Higher Gross Profit? Waste Management, Inc. or Watsco, Inc.
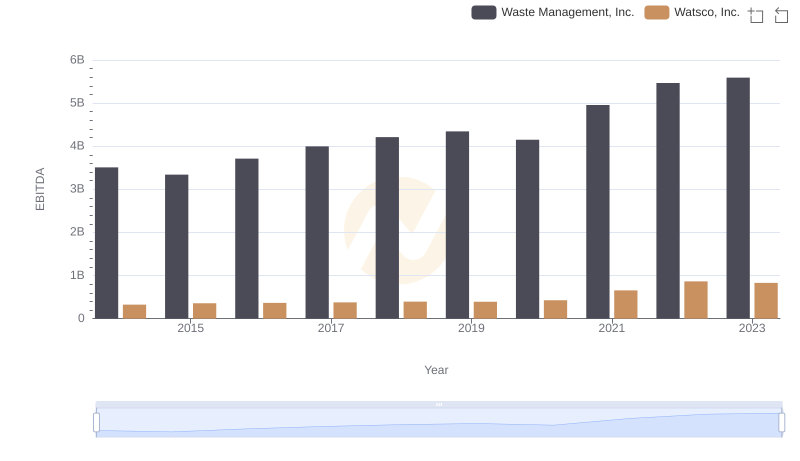
Professional EBITDA Benchmarking: Waste Management, Inc. vs Watsco, Inc.