| __timestamp | Howmet Aerospace Inc. | Trane Technologies plc |
|---|---|---|
| Wednesday, January 1, 2014 | 10349000000 | 8982800000 |
| Thursday, January 1, 2015 | 10104000000 | 9301600000 |
| Friday, January 1, 2016 | 9806000000 | 9329300000 |
| Sunday, January 1, 2017 | 10357000000 | 9811600000 |
| Monday, January 1, 2018 | 11397000000 | 10847600000 |
| Tuesday, January 1, 2019 | 11227000000 | 11451500000 |
| Wednesday, January 1, 2020 | 3878000000 | 8651300000 |
| Friday, January 1, 2021 | 3596000000 | 9666800000 |
| Saturday, January 1, 2022 | 4103000000 | 11026900000 |
| Sunday, January 1, 2023 | 4773000000 | 11820400000 |
| Monday, January 1, 2024 | 5119000000 | 12757700000 |
Unleashing insights
In the ever-evolving landscape of industrial manufacturing, Trane Technologies plc and Howmet Aerospace Inc. have showcased intriguing cost of revenue trends over the past decade. From 2014 to 2023, these industry titans have navigated economic shifts, technological advancements, and market demands, reflecting their resilience and strategic prowess.
Trane Technologies plc has demonstrated a steady upward trajectory, with its cost of revenue increasing by approximately 32% from 2014 to 2023. This growth underscores its robust operational strategies and market adaptability. In contrast, Howmet Aerospace Inc. experienced a significant dip in 2020, with costs plummeting by nearly 66% compared to 2019, likely due to global disruptions. However, a recovery is evident, with a 33% increase from 2020 to 2023, highlighting its resilience.
These trends offer valuable insights into the strategic maneuvers of these corporations, providing a window into their operational efficiencies and market positioning.
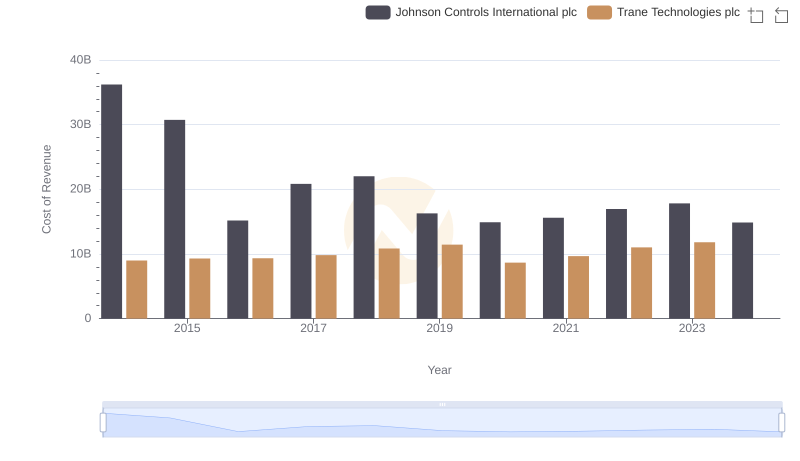
Cost of Revenue Comparison: Trane Technologies plc vs Johnson Controls International plc
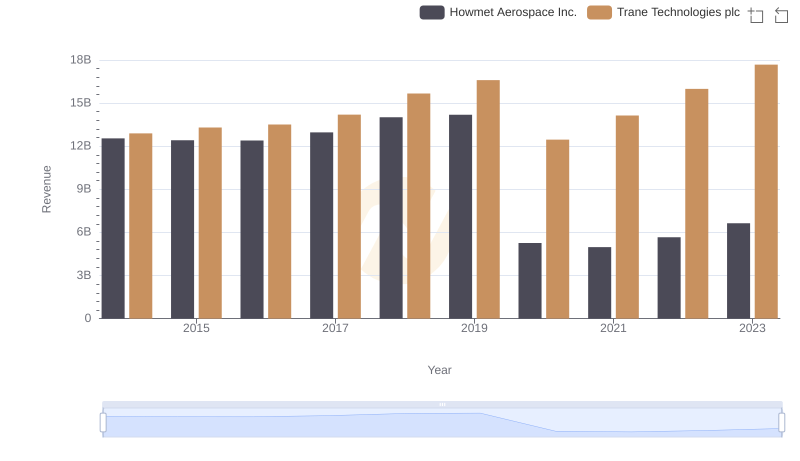
Breaking Down Revenue Trends: Trane Technologies plc vs Howmet Aerospace Inc.
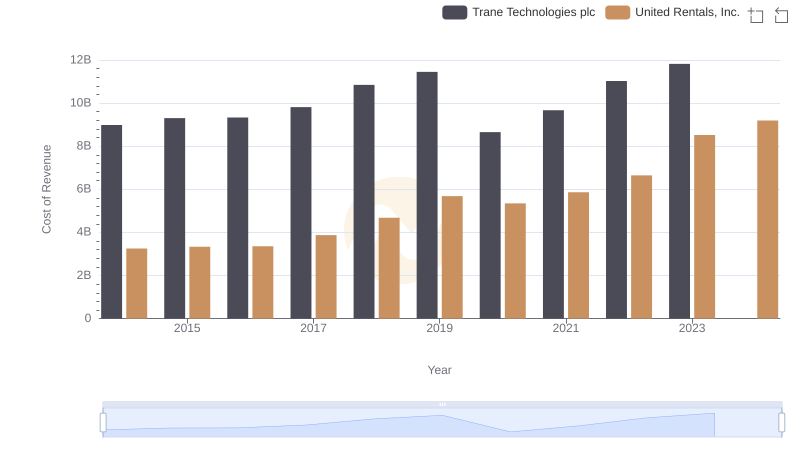
Cost of Revenue Trends: Trane Technologies plc vs United Rentals, Inc.
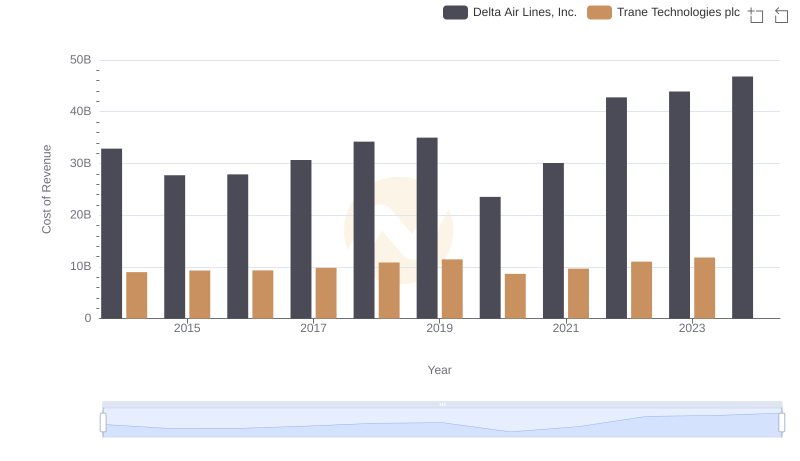
Analyzing Cost of Revenue: Trane Technologies plc and Delta Air Lines, Inc.
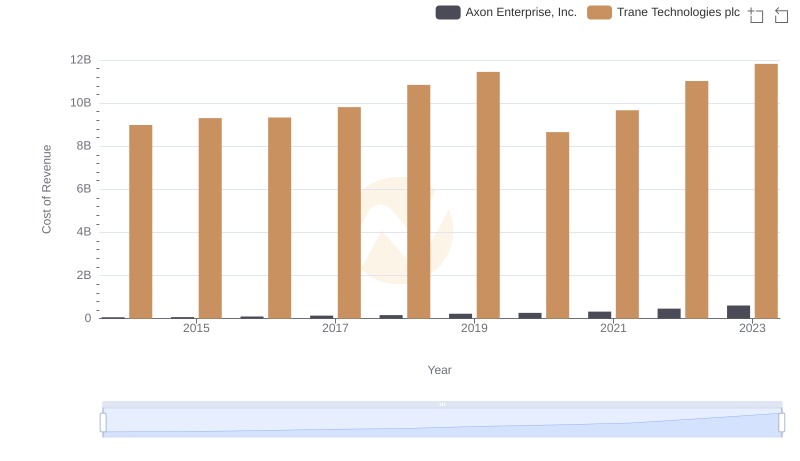
Cost of Revenue: Key Insights for Trane Technologies plc and Axon Enterprise, Inc.
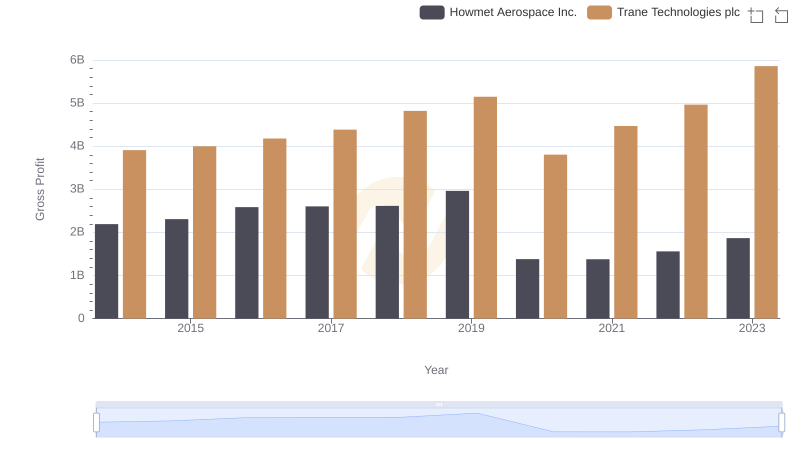
Gross Profit Comparison: Trane Technologies plc and Howmet Aerospace Inc. Trends
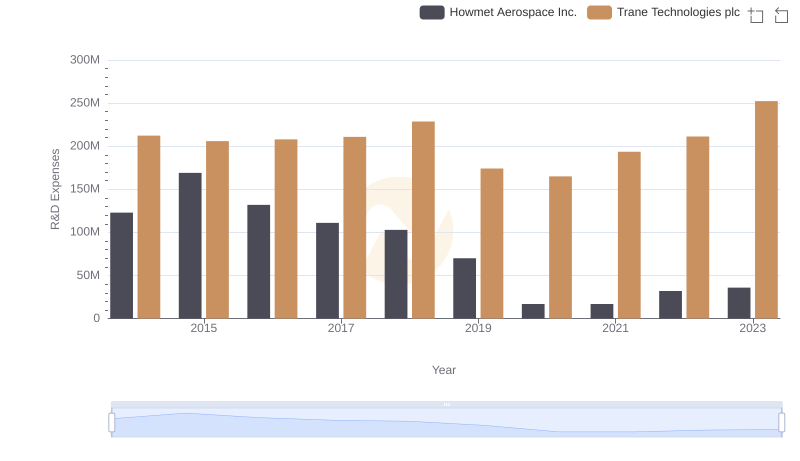
Analyzing R&D Budgets: Trane Technologies plc vs Howmet Aerospace Inc.