| __timestamp | Trane Technologies plc | United Rentals, Inc. |
|---|---|---|
| Wednesday, January 1, 2014 | 8982800000 | 3253000000 |
| Thursday, January 1, 2015 | 9301600000 | 3337000000 |
| Friday, January 1, 2016 | 9329300000 | 3359000000 |
| Sunday, January 1, 2017 | 9811600000 | 3872000000 |
| Monday, January 1, 2018 | 10847600000 | 4683000000 |
| Tuesday, January 1, 2019 | 11451500000 | 5681000000 |
| Wednesday, January 1, 2020 | 8651300000 | 5347000000 |
| Friday, January 1, 2021 | 9666800000 | 5863000000 |
| Saturday, January 1, 2022 | 11026900000 | 6646000000 |
| Sunday, January 1, 2023 | 11820400000 | 8519000000 |
| Monday, January 1, 2024 | 12757700000 | 9195000000 |
Data in motion
In the ever-evolving landscape of industrial giants, understanding cost dynamics is crucial. Trane Technologies plc and United Rentals, Inc. have shown distinct trends in their cost of revenue from 2014 to 2023. Trane Technologies, a leader in climate solutions, has seen a steady increase in its cost of revenue, peaking at approximately 11.8 billion in 2023, marking a 32% rise from 2014. Meanwhile, United Rentals, the largest equipment rental company globally, experienced a more dramatic surge, with costs climbing by 162% over the same period, reaching around 8.5 billion in 2023. This divergence highlights differing operational strategies and market conditions. Notably, data for Trane Technologies in 2024 is missing, suggesting potential shifts or reporting changes. As these companies navigate economic challenges, their cost management strategies will be pivotal in maintaining competitive edges.
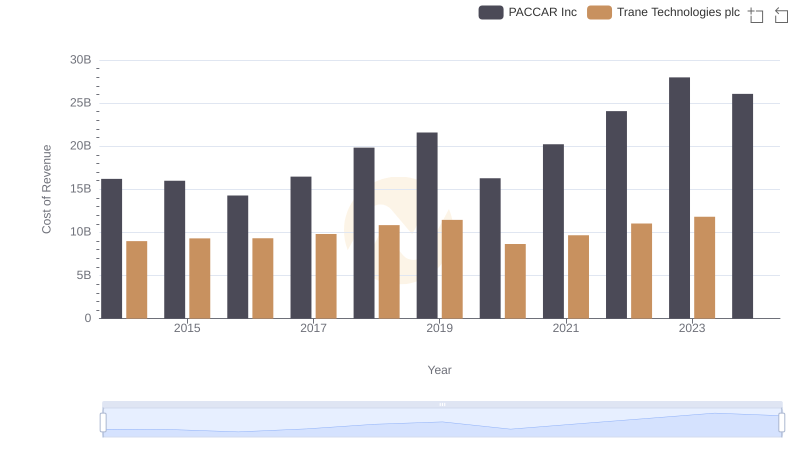
Cost Insights: Breaking Down Trane Technologies plc and PACCAR Inc's Expenses
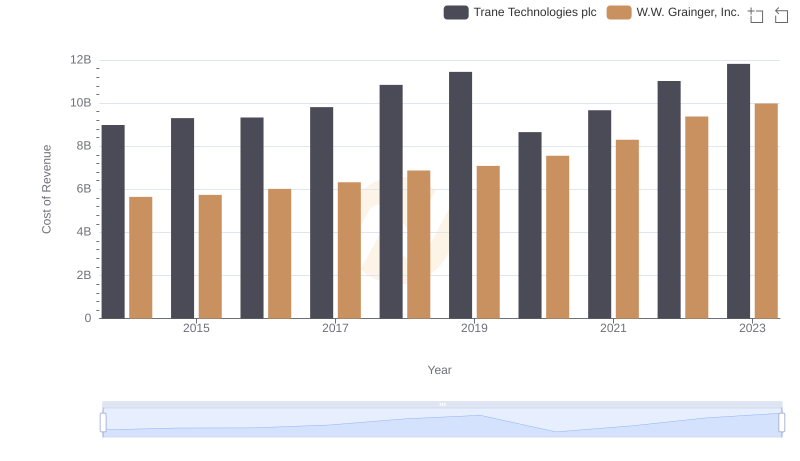
Cost Insights: Breaking Down Trane Technologies plc and W.W. Grainger, Inc.'s Expenses
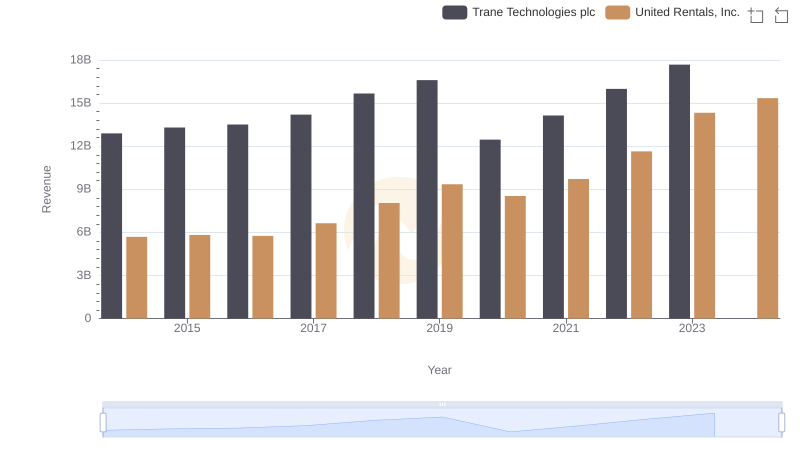
Who Generates More Revenue? Trane Technologies plc or United Rentals, Inc.
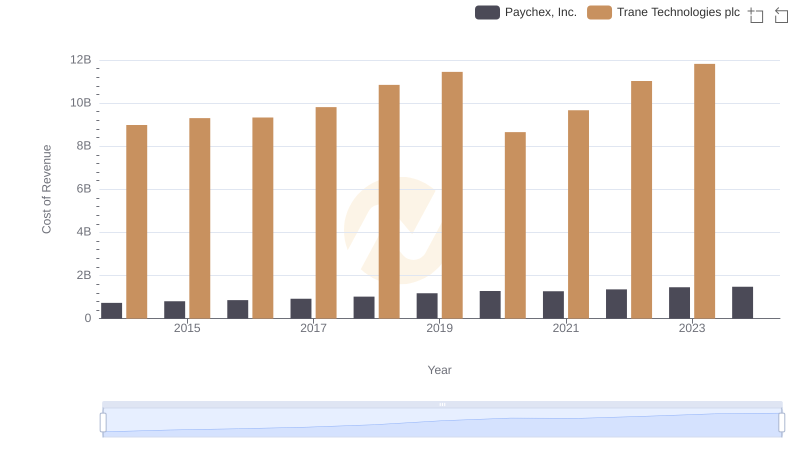
Cost Insights: Breaking Down Trane Technologies plc and Paychex, Inc.'s Expenses
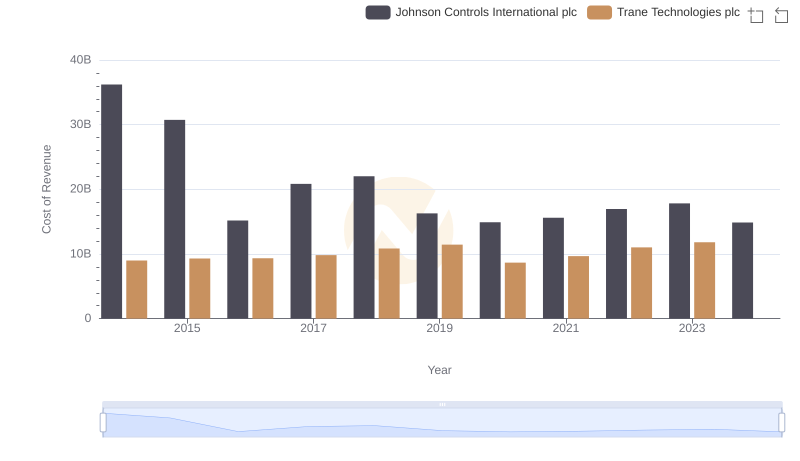
Cost of Revenue Comparison: Trane Technologies plc vs Johnson Controls International plc
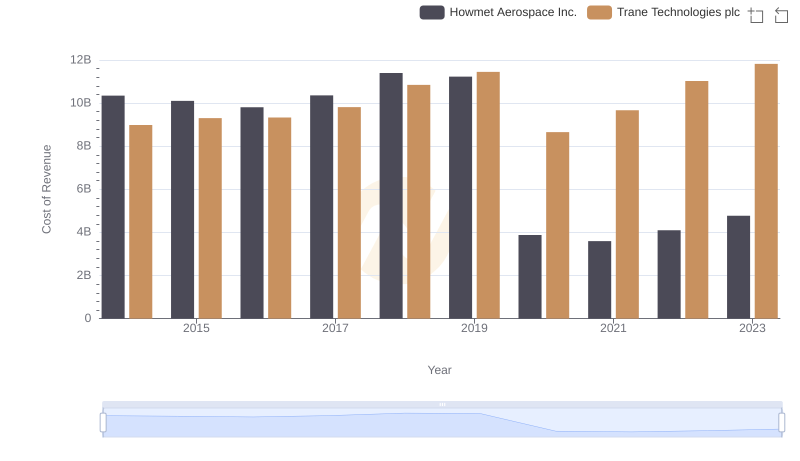
Cost of Revenue Trends: Trane Technologies plc vs Howmet Aerospace Inc.
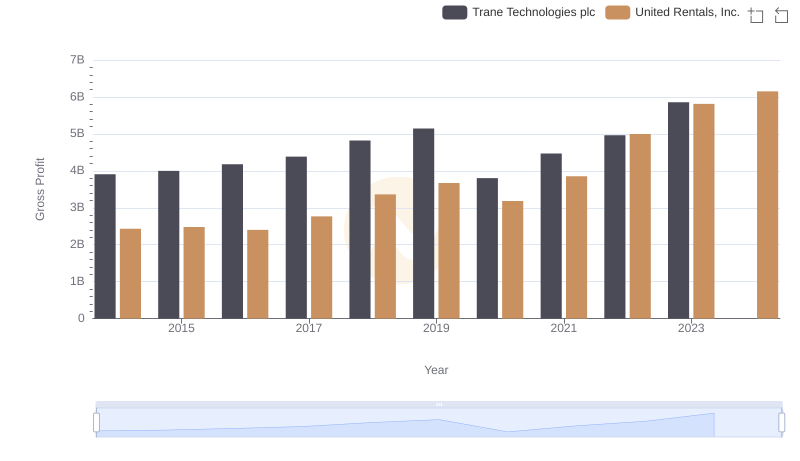
Trane Technologies plc vs United Rentals, Inc.: A Gross Profit Performance Breakdown
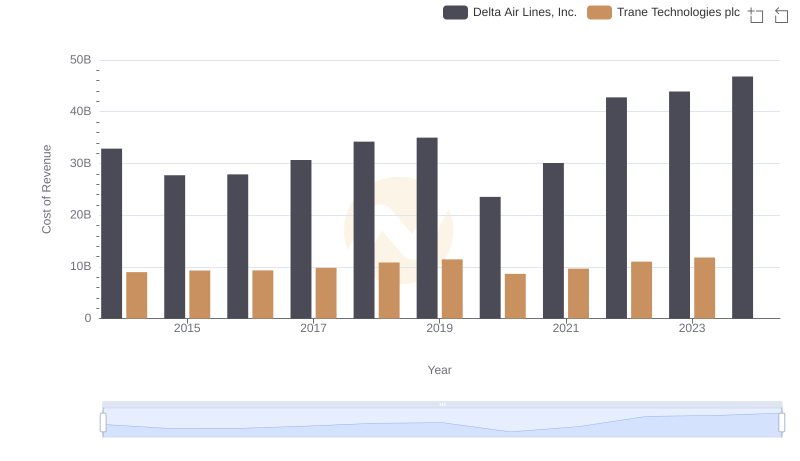
Analyzing Cost of Revenue: Trane Technologies plc and Delta Air Lines, Inc.
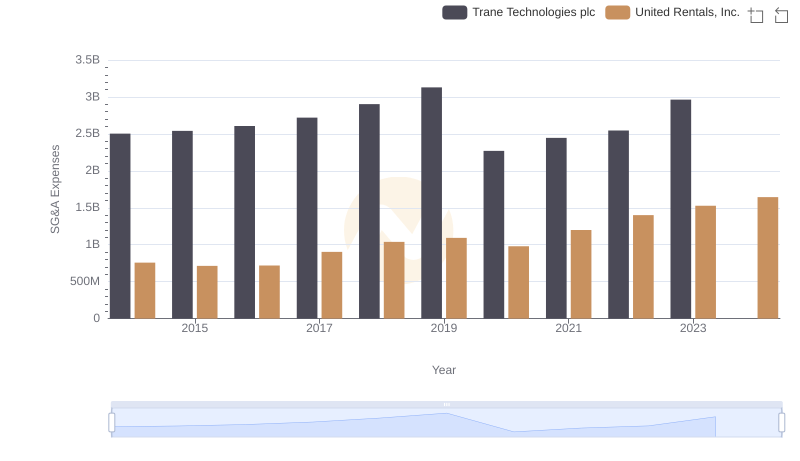
Trane Technologies plc or United Rentals, Inc.: Who Manages SG&A Costs Better?
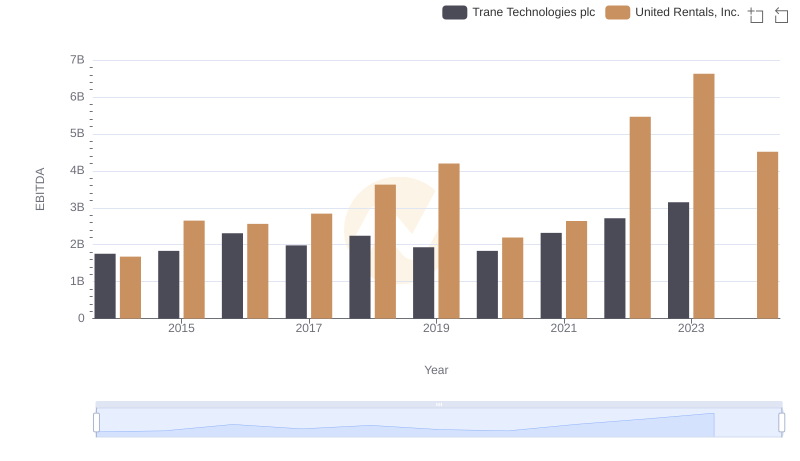
Comparative EBITDA Analysis: Trane Technologies plc vs United Rentals, Inc.