| __timestamp | Rockwell Automation, Inc. | Southwest Airlines Co. |
|---|---|---|
| Wednesday, January 1, 2014 | 3869600000 | 14049000000 |
| Thursday, January 1, 2015 | 3604800000 | 13423000000 |
| Friday, January 1, 2016 | 3404000000 | 14151000000 |
| Sunday, January 1, 2017 | 3687100000 | 14968000000 |
| Monday, January 1, 2018 | 3793800000 | 15907000000 |
| Tuesday, January 1, 2019 | 3794700000 | 16445000000 |
| Wednesday, January 1, 2020 | 3734600000 | 10938000000 |
| Friday, January 1, 2021 | 4099700000 | 11675000000 |
| Saturday, January 1, 2022 | 4658400000 | 19062000000 |
| Sunday, January 1, 2023 | 5341000000 | 21868000000 |
| Monday, January 1, 2024 | 5070800000 | 23024000000 |
In pursuit of knowledge
In the ever-evolving landscape of corporate expenses, understanding cost structures is crucial for investors and stakeholders. This analysis delves into the cost of revenue trends for Rockwell Automation, Inc. and Southwest Airlines Co. from 2014 to 2023. Over this period, Rockwell Automation's cost of revenue increased by approximately 38%, peaking in 2023. Meanwhile, Southwest Airlines experienced a 56% rise, with a notable dip in 2020, likely due to the pandemic's impact on the airline industry. By 2023, Southwest's cost of revenue was nearly four times that of Rockwell Automation, highlighting the distinct operational scales and challenges faced by these companies. Missing data for 2024 suggests ongoing financial adjustments. This comparative insight underscores the importance of strategic cost management in maintaining competitive advantage.
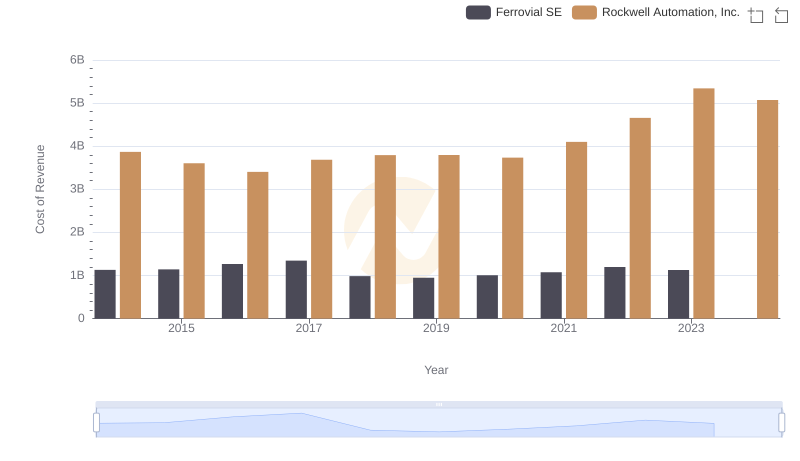
Comparing Cost of Revenue Efficiency: Rockwell Automation, Inc. vs Ferrovial SE
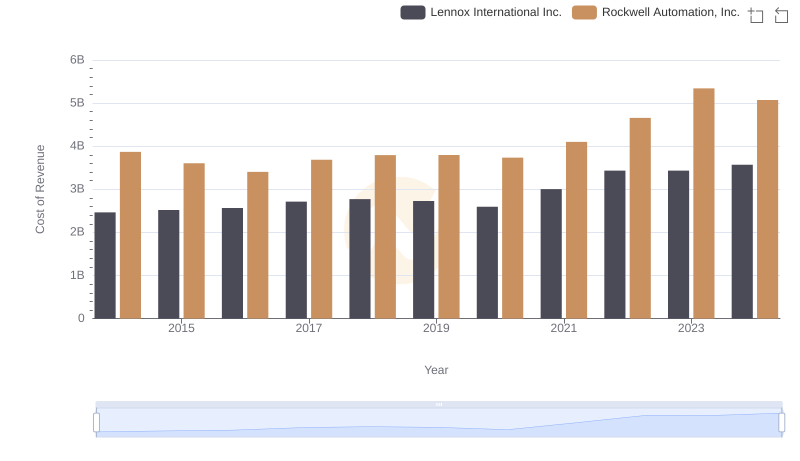
Cost of Revenue Trends: Rockwell Automation, Inc. vs Lennox International Inc.
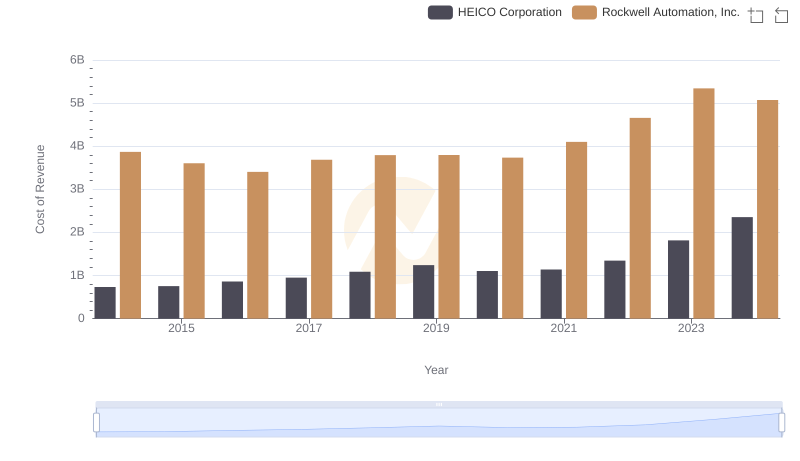
Analyzing Cost of Revenue: Rockwell Automation, Inc. and HEICO Corporation
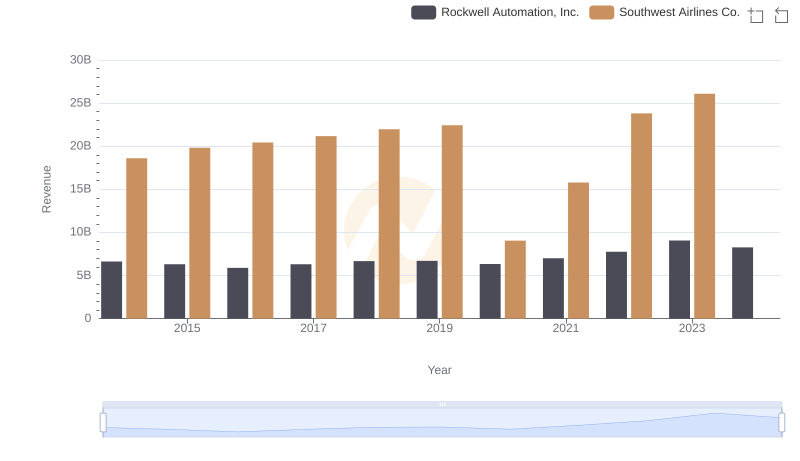
Revenue Showdown: Rockwell Automation, Inc. vs Southwest Airlines Co.
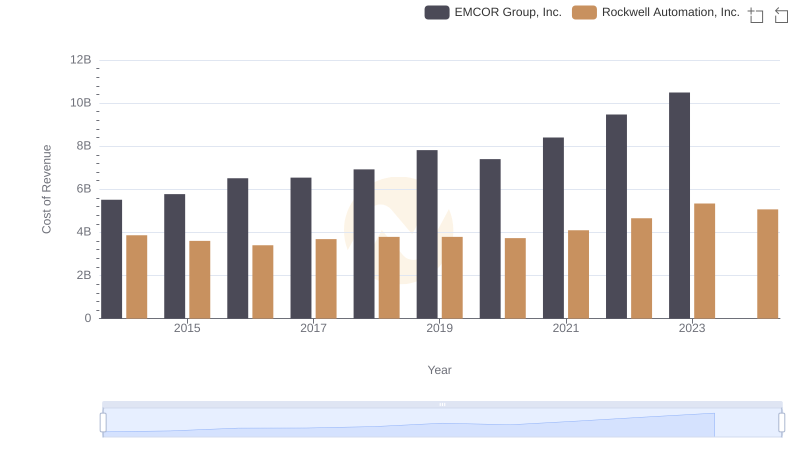
Cost of Revenue Comparison: Rockwell Automation, Inc. vs EMCOR Group, Inc.
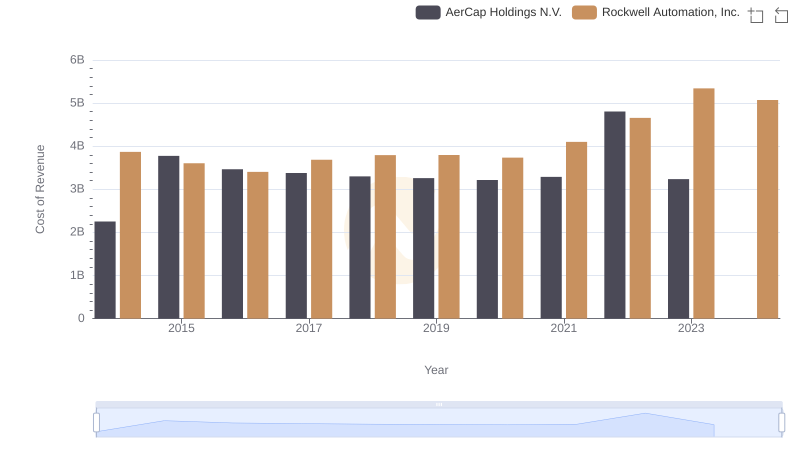
Analyzing Cost of Revenue: Rockwell Automation, Inc. and AerCap Holdings N.V.

Cost Insights: Breaking Down Rockwell Automation, Inc. and TransUnion's Expenses
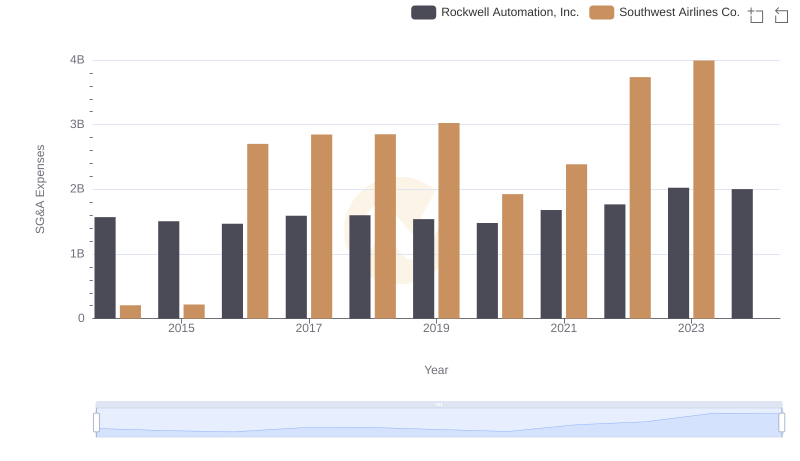
Rockwell Automation, Inc. and Southwest Airlines Co.: SG&A Spending Patterns Compared