| __timestamp | Rockwell Automation, Inc. | Stanley Black & Decker, Inc. |
|---|---|---|
| Wednesday, January 1, 2014 | 3869600000 | 7235900000 |
| Thursday, January 1, 2015 | 3604800000 | 7099800000 |
| Friday, January 1, 2016 | 3404000000 | 7139700000 |
| Sunday, January 1, 2017 | 3687100000 | 7969200000 |
| Monday, January 1, 2018 | 3793800000 | 9080500000 |
| Tuesday, January 1, 2019 | 3794700000 | 9636700000 |
| Wednesday, January 1, 2020 | 3734600000 | 9566700000 |
| Friday, January 1, 2021 | 4099700000 | 10423000000 |
| Saturday, January 1, 2022 | 4658400000 | 12663300000 |
| Sunday, January 1, 2023 | 5341000000 | 11683100000 |
| Monday, January 1, 2024 | 5070800000 | 10851300000 |
Igniting the spark of knowledge
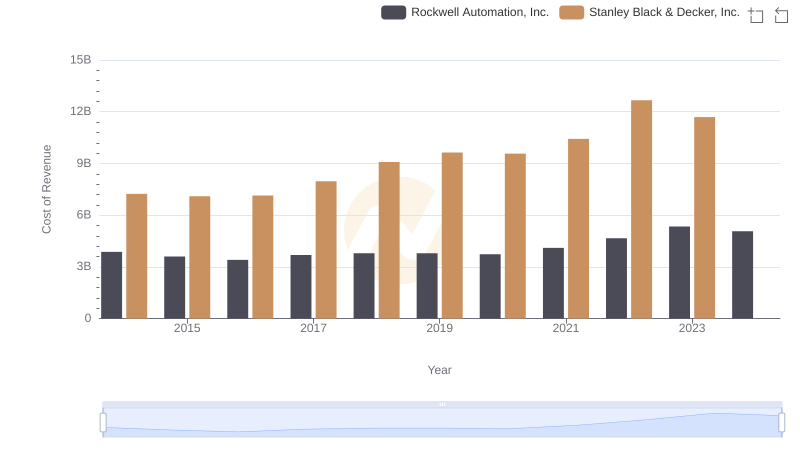
In the competitive landscape of industrial automation and tools, Rockwell Automation, Inc. and Stanley Black & Decker, Inc. have been pivotal players. Over the past decade, Rockwell Automation has demonstrated a steady increase in cost of revenue efficiency, with a notable 37% rise from 2014 to 2023. In contrast, Stanley Black & Decker's cost of revenue surged by approximately 61% during the same period, reflecting its expansive growth strategy.
From 2014 to 2023, Rockwell Automation's cost of revenue efficiency improved significantly, peaking in 2023. Meanwhile, Stanley Black & Decker experienced a more volatile trajectory, with a peak in 2022. The data for 2024 is incomplete, highlighting the dynamic nature of financial forecasting. This comparison underscores the strategic differences between these industry leaders, offering insights into their operational efficiencies and market strategies.
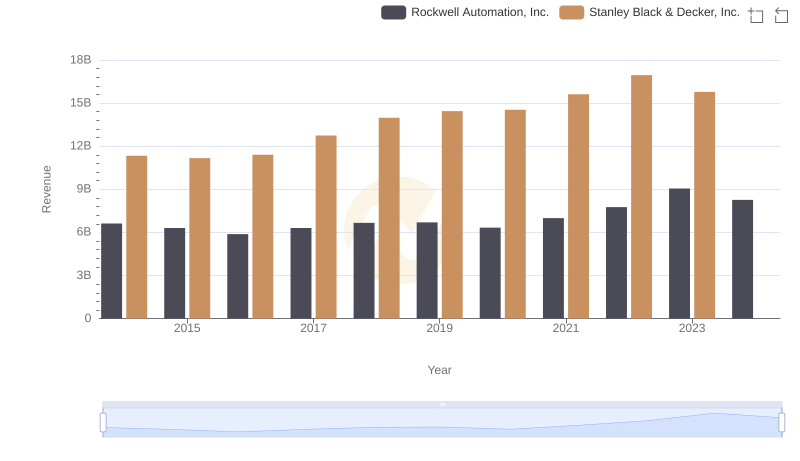
Who Generates More Revenue? Rockwell Automation, Inc. or Stanley Black & Decker, Inc.
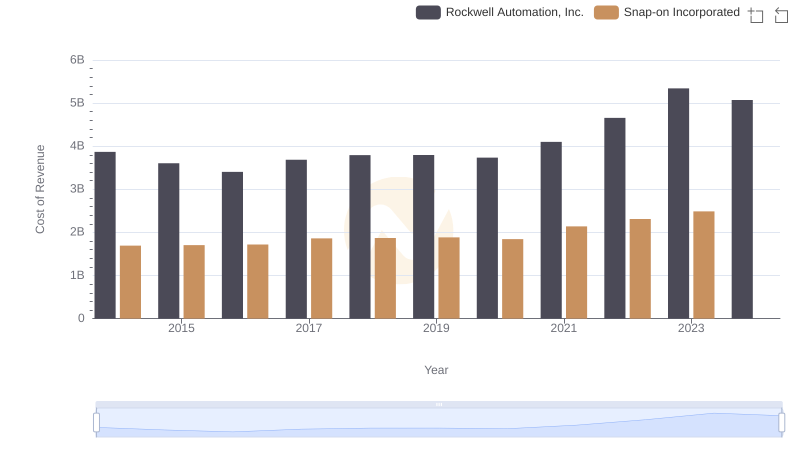
Cost Insights: Breaking Down Rockwell Automation, Inc. and Snap-on Incorporated's Expenses

Who Generates Higher Gross Profit? Rockwell Automation, Inc. or Stanley Black & Decker, Inc.
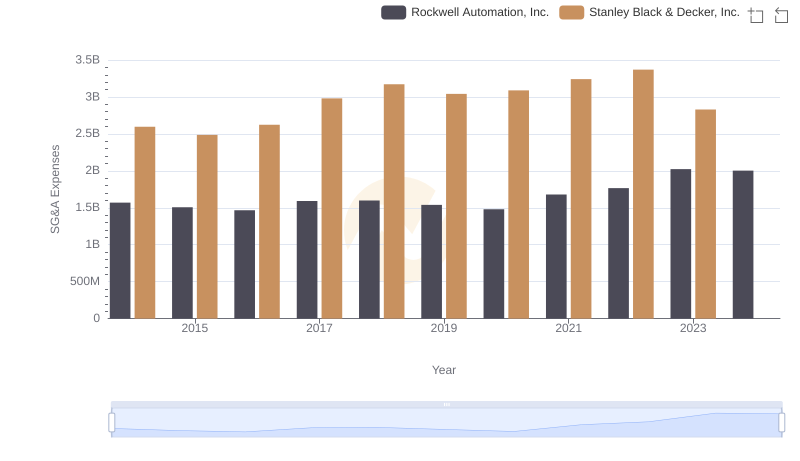
Selling, General, and Administrative Costs: Rockwell Automation, Inc. vs Stanley Black & Decker, Inc.
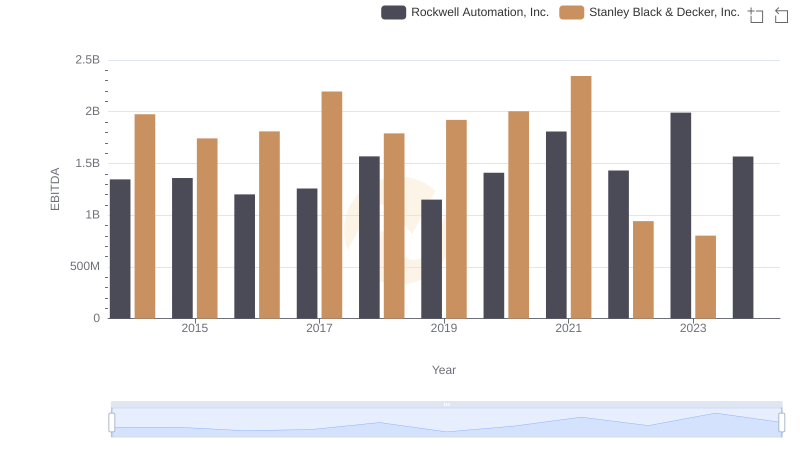
Rockwell Automation, Inc. and Stanley Black & Decker, Inc.: A Detailed Examination of EBITDA Performance
Rockwell Automation, Inc. vs Stanley Black & Decker, Inc.: Efficiency in Cost of Revenue Explored
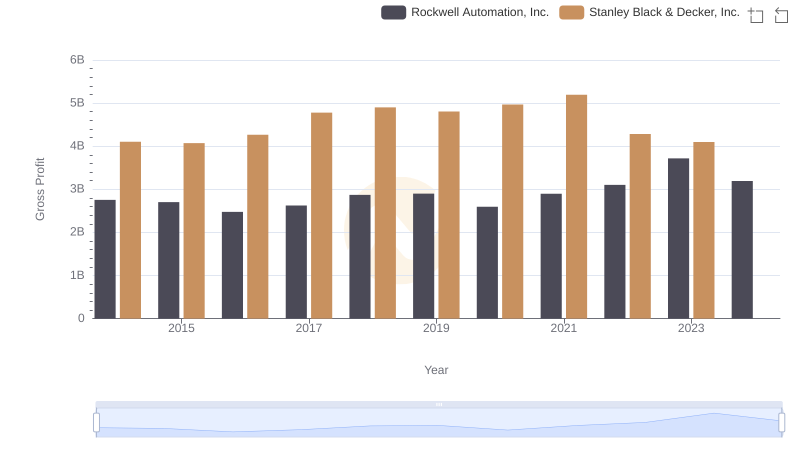
Who Generates Higher Gross Profit? Rockwell Automation, Inc. or Stanley Black & Decker, Inc.
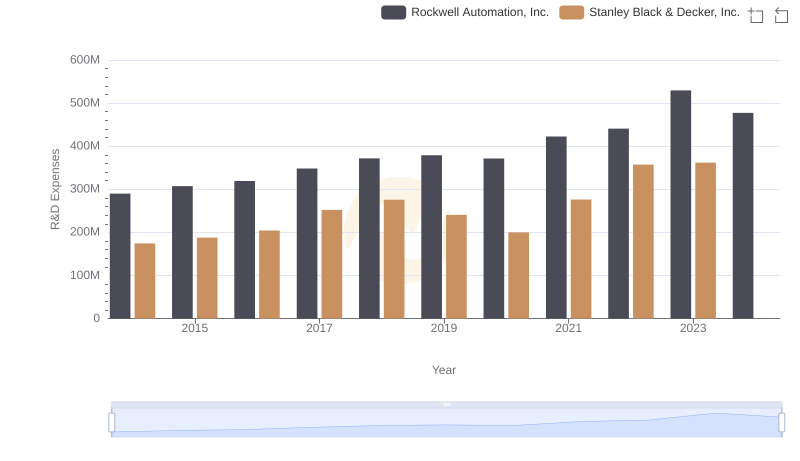
Rockwell Automation, Inc. or Stanley Black & Decker, Inc.: Who Invests More in Innovation?

Who Optimizes SG&A Costs Better? Rockwell Automation, Inc. or Stanley Black & Decker, Inc.

Comprehensive EBITDA Comparison: Rockwell Automation, Inc. vs Stanley Black & Decker, Inc.