| __timestamp | Rockwell Automation, Inc. | Snap-on Incorporated |
|---|---|---|
| Wednesday, January 1, 2014 | 3869600000 | 1693400000 |
| Thursday, January 1, 2015 | 3604800000 | 1704500000 |
| Friday, January 1, 2016 | 3404000000 | 1720800000 |
| Sunday, January 1, 2017 | 3687100000 | 1862000000 |
| Monday, January 1, 2018 | 3793800000 | 1870700000 |
| Tuesday, January 1, 2019 | 3794700000 | 1886000000 |
| Wednesday, January 1, 2020 | 3734600000 | 1844000000 |
| Friday, January 1, 2021 | 4099700000 | 2141200000 |
| Saturday, January 1, 2022 | 4658400000 | 2311700000 |
| Sunday, January 1, 2023 | 5341000000 | 2488500000 |
| Monday, January 1, 2024 | 5070800000 | 2329500000 |
In pursuit of knowledge
In the ever-evolving landscape of industrial automation and tools, understanding cost structures is pivotal. Rockwell Automation, Inc. and Snap-on Incorporated, two giants in their respective fields, have shown intriguing trends in their cost of revenue over the past decade. From 2014 to 2023, Rockwell Automation's cost of revenue surged by approximately 38%, peaking in 2023. This reflects a strategic expansion and increased operational scale. In contrast, Snap-on Incorporated experienced a 47% increase in the same period, highlighting its robust growth in the tools sector. Notably, 2024 data for Snap-on is missing, suggesting a potential gap in reporting or a strategic shift. These insights provide a window into the financial dynamics of these industry leaders, offering valuable lessons for investors and analysts alike.
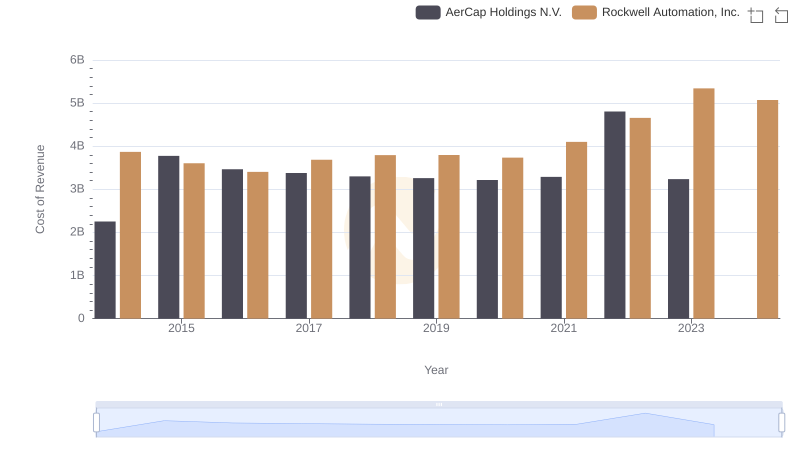
Analyzing Cost of Revenue: Rockwell Automation, Inc. and AerCap Holdings N.V.

Cost Insights: Breaking Down Rockwell Automation, Inc. and TransUnion's Expenses
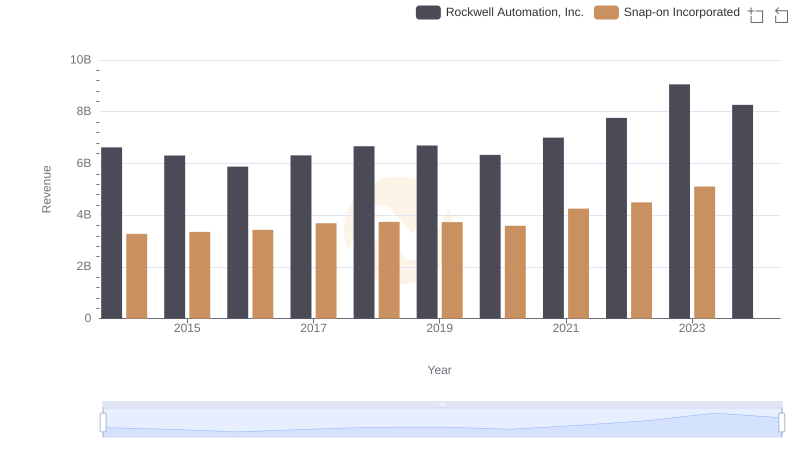
Rockwell Automation, Inc. or Snap-on Incorporated: Who Leads in Yearly Revenue?
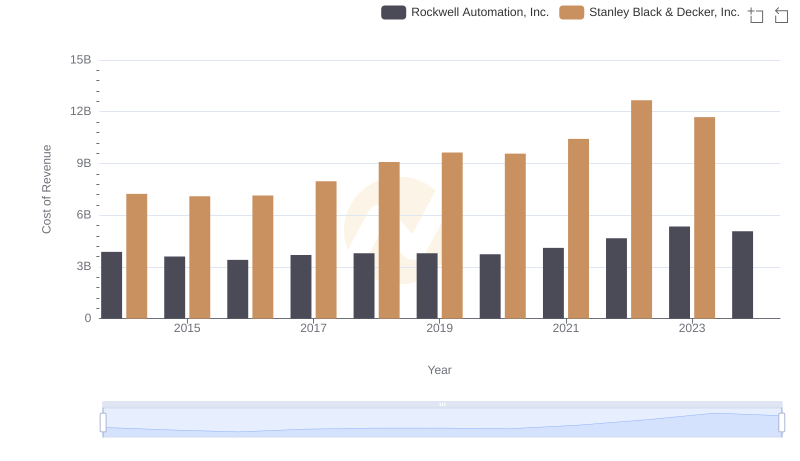
Comparing Cost of Revenue Efficiency: Rockwell Automation, Inc. vs Stanley Black & Decker, Inc.
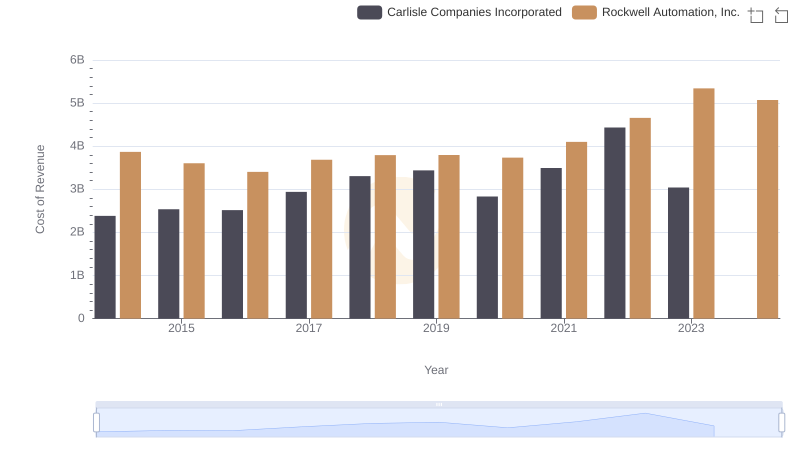
Cost of Revenue Trends: Rockwell Automation, Inc. vs Carlisle Companies Incorporated
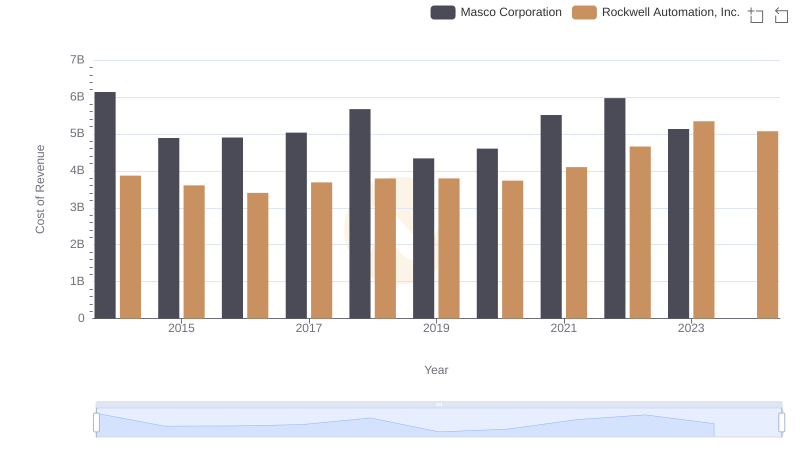
Analyzing Cost of Revenue: Rockwell Automation, Inc. and Masco Corporation
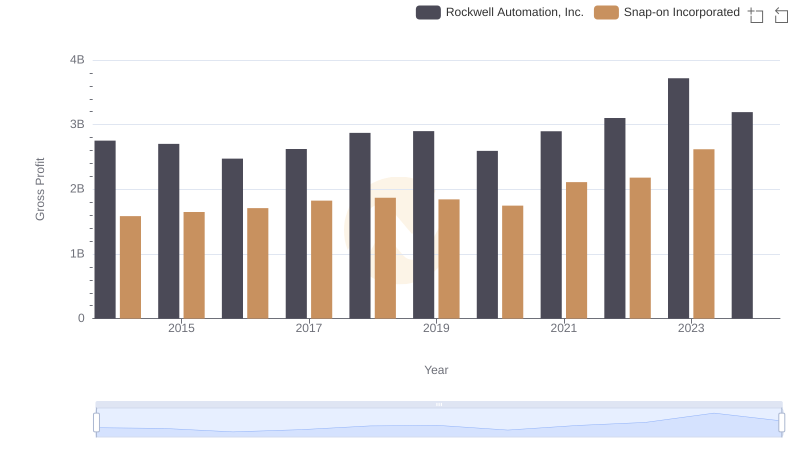
Who Generates Higher Gross Profit? Rockwell Automation, Inc. or Snap-on Incorporated
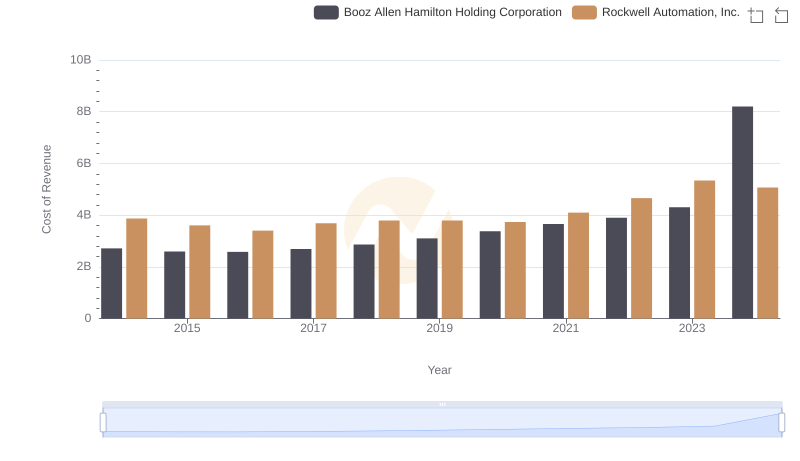
Rockwell Automation, Inc. vs Booz Allen Hamilton Holding Corporation: Efficiency in Cost of Revenue Explored
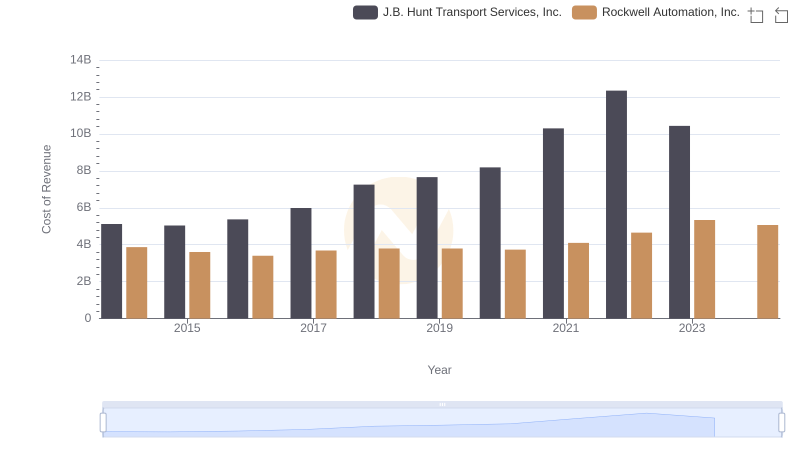
Analyzing Cost of Revenue: Rockwell Automation, Inc. and J.B. Hunt Transport Services, Inc.
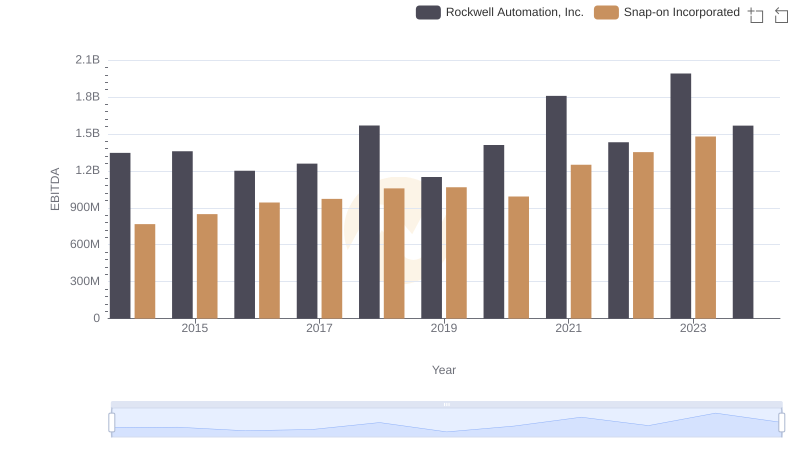
EBITDA Metrics Evaluated: Rockwell Automation, Inc. vs Snap-on Incorporated