| __timestamp | Carlisle Companies Incorporated | Rockwell Automation, Inc. |
|---|---|---|
| Wednesday, January 1, 2014 | 2384500000 | 3869600000 |
| Thursday, January 1, 2015 | 2536500000 | 3604800000 |
| Friday, January 1, 2016 | 2518100000 | 3404000000 |
| Sunday, January 1, 2017 | 2941900000 | 3687100000 |
| Monday, January 1, 2018 | 3304800000 | 3793800000 |
| Tuesday, January 1, 2019 | 3439900000 | 3794700000 |
| Wednesday, January 1, 2020 | 2832500000 | 3734600000 |
| Friday, January 1, 2021 | 3495600000 | 4099700000 |
| Saturday, January 1, 2022 | 4434500000 | 4658400000 |
| Sunday, January 1, 2023 | 3042900000 | 5341000000 |
| Monday, January 1, 2024 | 3115900000 | 5070800000 |
Unleashing the power of data
In the ever-evolving landscape of industrial automation and manufacturing, understanding cost dynamics is crucial. Rockwell Automation, Inc. and Carlisle Companies Incorporated, two giants in their respective fields, have shown intriguing trends in their cost of revenue over the past decade. From 2014 to 2023, Rockwell Automation's cost of revenue has seen a steady increase, peaking at approximately 5.34 billion in 2023, marking a 38% rise from 2014. In contrast, Carlisle Companies experienced a more volatile trajectory, with a notable peak in 2022 at around 4.43 billion, before dropping to 3.04 billion in 2023. This fluctuation highlights the challenges faced by Carlisle in maintaining cost efficiency. The data for 2024 is incomplete, leaving room for speculation on future trends. These insights provide a window into the financial strategies and market conditions influencing these industry leaders.
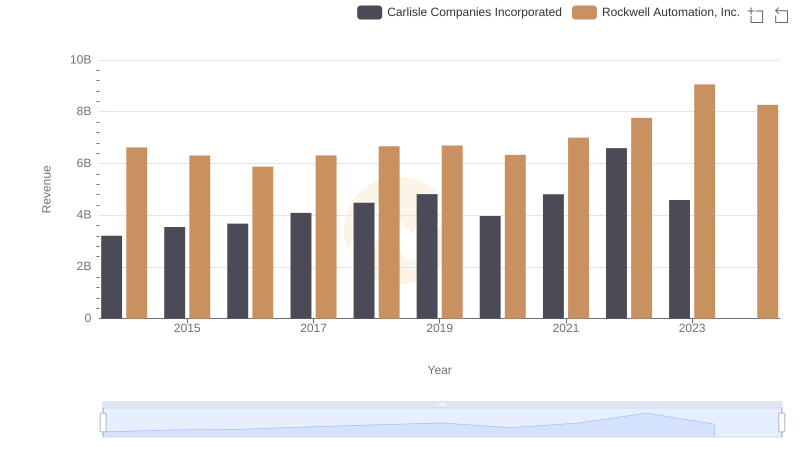
Rockwell Automation, Inc. vs Carlisle Companies Incorporated: Examining Key Revenue Metrics
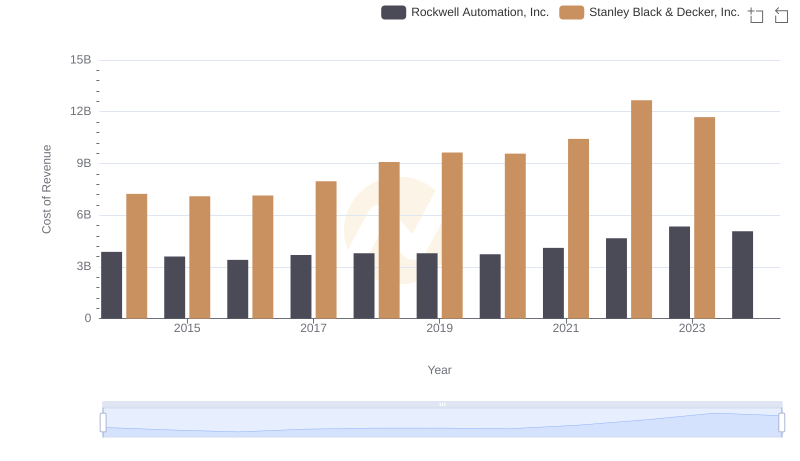
Comparing Cost of Revenue Efficiency: Rockwell Automation, Inc. vs Stanley Black & Decker, Inc.
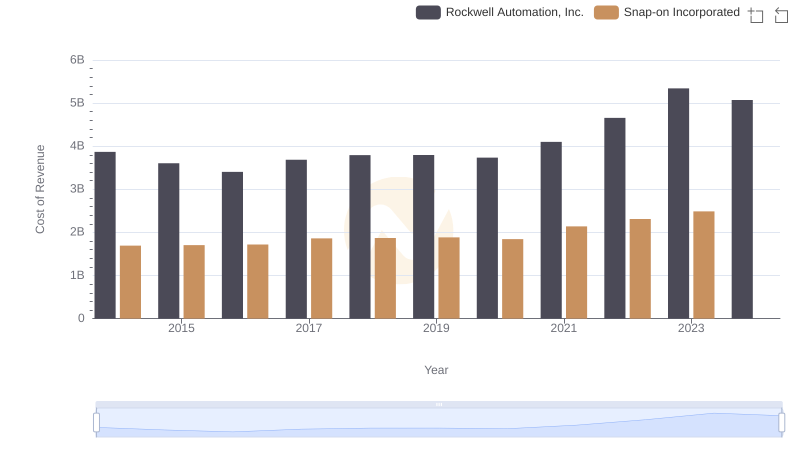
Cost Insights: Breaking Down Rockwell Automation, Inc. and Snap-on Incorporated's Expenses
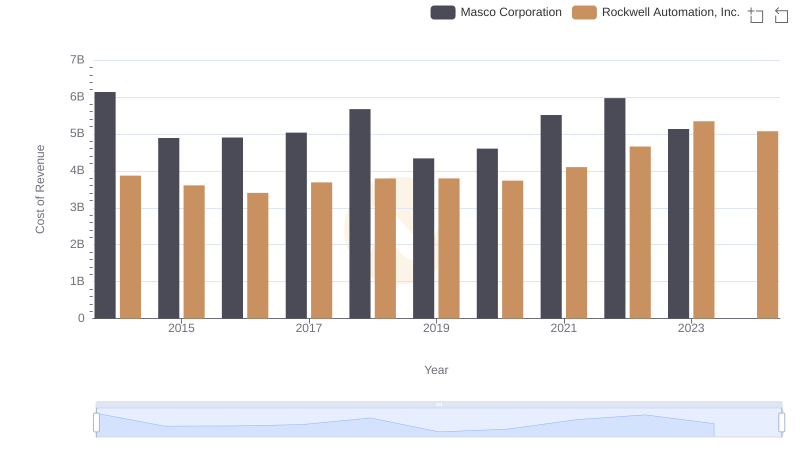
Analyzing Cost of Revenue: Rockwell Automation, Inc. and Masco Corporation
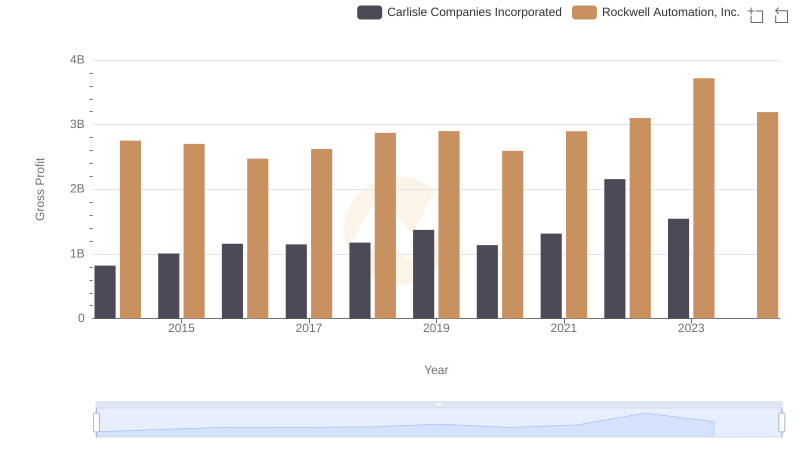
Gross Profit Analysis: Comparing Rockwell Automation, Inc. and Carlisle Companies Incorporated
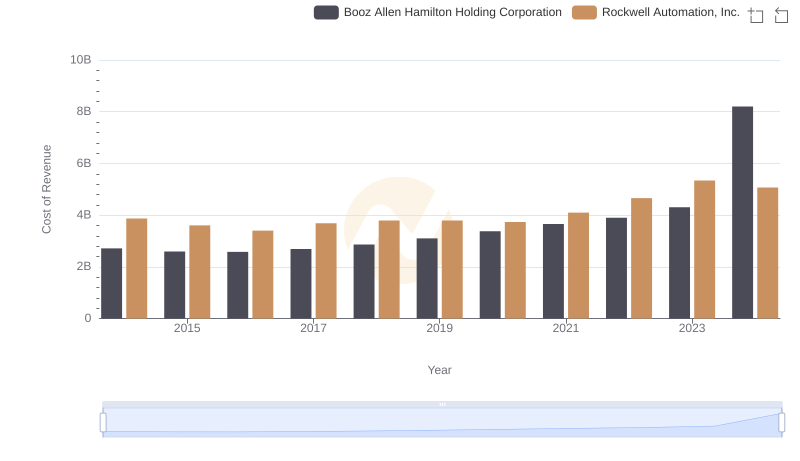
Rockwell Automation, Inc. vs Booz Allen Hamilton Holding Corporation: Efficiency in Cost of Revenue Explored
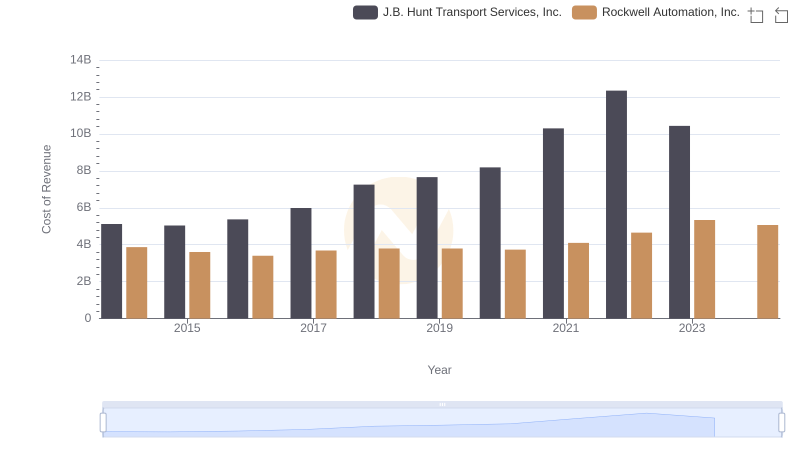
Analyzing Cost of Revenue: Rockwell Automation, Inc. and J.B. Hunt Transport Services, Inc.
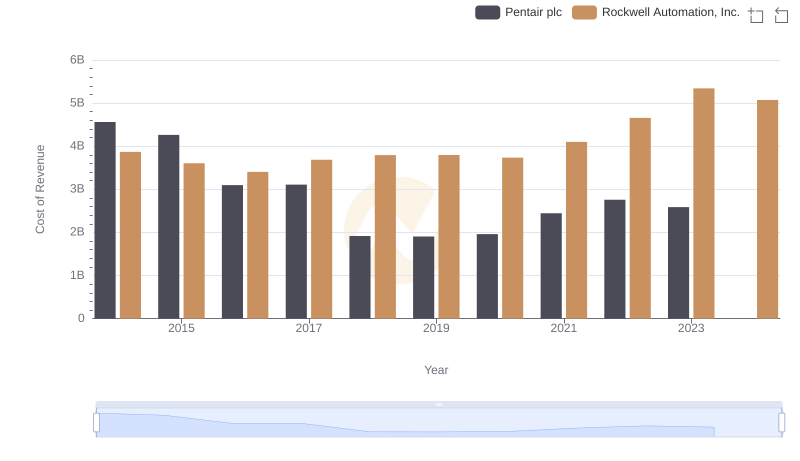
Cost of Revenue Trends: Rockwell Automation, Inc. vs Pentair plc
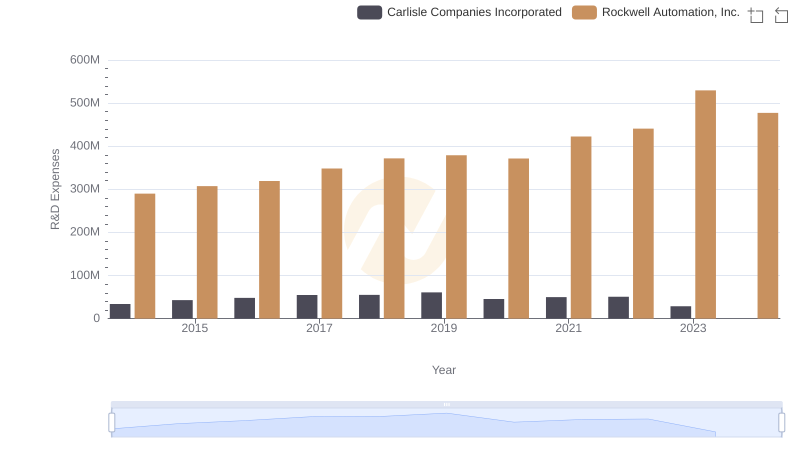
Rockwell Automation, Inc. or Carlisle Companies Incorporated: Who Invests More in Innovation?
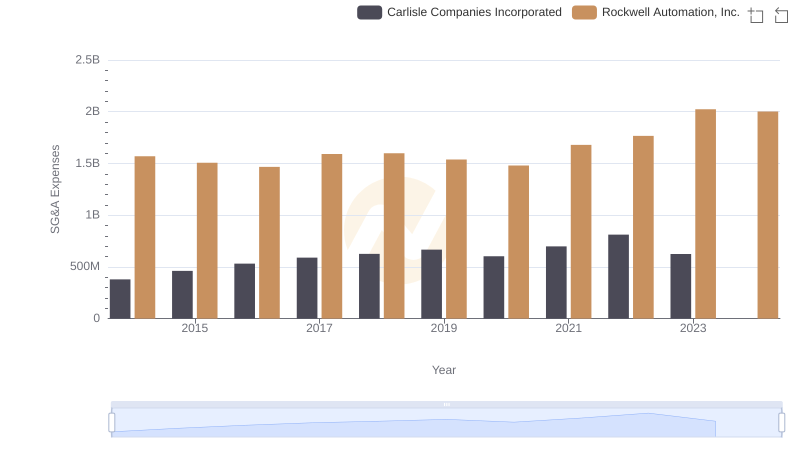
SG&A Efficiency Analysis: Comparing Rockwell Automation, Inc. and Carlisle Companies Incorporated

A Side-by-Side Analysis of EBITDA: Rockwell Automation, Inc. and Carlisle Companies Incorporated