| __timestamp | Rentokil Initial plc | Rockwell Automation, Inc. |
|---|---|---|
| Wednesday, January 1, 2014 | 410400000 | 1346000000 |
| Thursday, January 1, 2015 | 408700000 | 1359100000 |
| Friday, January 1, 2016 | 489000000 | 1200700000 |
| Sunday, January 1, 2017 | 503200000 | 1258400000 |
| Monday, January 1, 2018 | 149800000 | 1568400000 |
| Tuesday, January 1, 2019 | 580600000 | 1150200000 |
| Wednesday, January 1, 2020 | 581000000 | 1410200000 |
| Friday, January 1, 2021 | 656000000 | 1808300000 |
| Saturday, January 1, 2022 | 767000000 | 1432100000 |
| Sunday, January 1, 2023 | 1157000000 | 1990700000 |
| Monday, January 1, 2024 | 1567500000 |
Data in motion
In the ever-evolving landscape of global business, understanding the financial health of industry giants is crucial. This analysis pits Rockwell Automation, Inc. against Rentokil Initial plc, two titans in their respective fields, by examining their EBITDA from 2014 to 2023.
Rockwell Automation, a leader in industrial automation, consistently outperformed Rentokil Initial, a global pest control and hygiene services provider, with an average EBITDA nearly 2.6 times higher. Notably, Rockwell's EBITDA peaked in 2023, reaching almost 2 billion, a 48% increase from 2014. Meanwhile, Rentokil's EBITDA saw a significant rise, especially in 2023, where it more than doubled compared to 2014, highlighting its robust growth strategy.
While Rockwell's 2024 data remains elusive, Rentokil's absence in the same year suggests potential reporting delays. This financial duel underscores the dynamic nature of global markets and the importance of strategic financial planning.
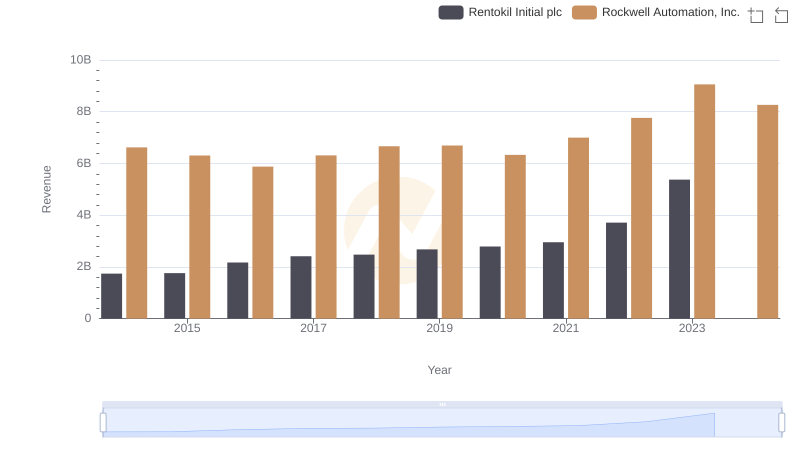
Rockwell Automation, Inc. vs Rentokil Initial plc: Examining Key Revenue Metrics
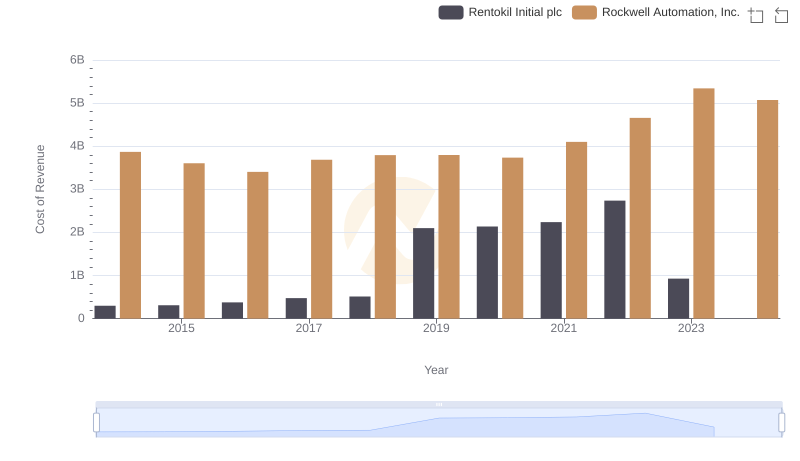
Cost Insights: Breaking Down Rockwell Automation, Inc. and Rentokil Initial plc's Expenses
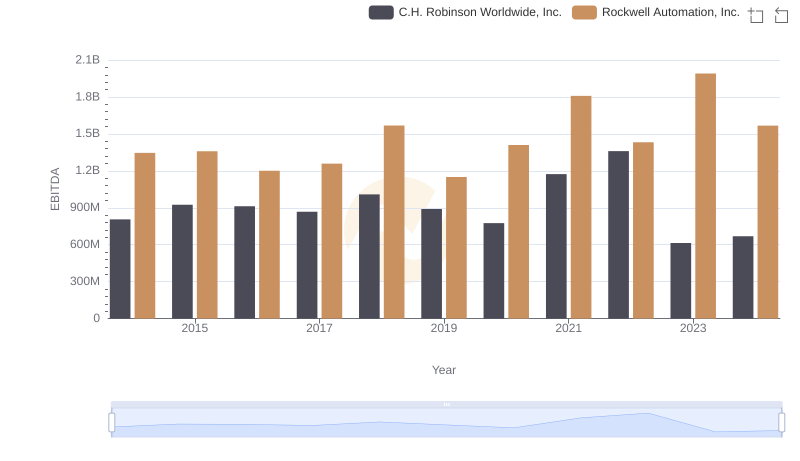
Rockwell Automation, Inc. and C.H. Robinson Worldwide, Inc.: A Detailed Examination of EBITDA Performance
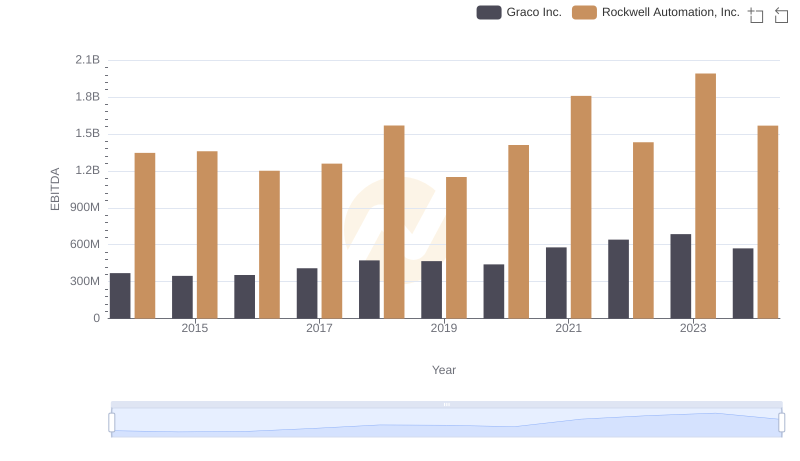
A Side-by-Side Analysis of EBITDA: Rockwell Automation, Inc. and Graco Inc.
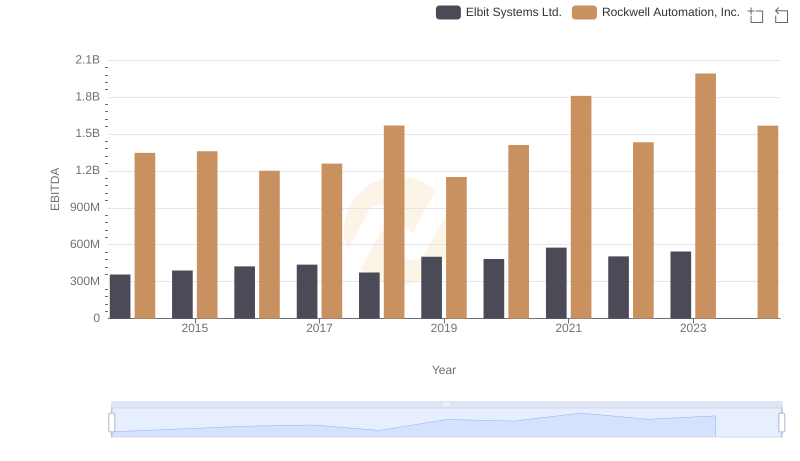
EBITDA Performance Review: Rockwell Automation, Inc. vs Elbit Systems Ltd.
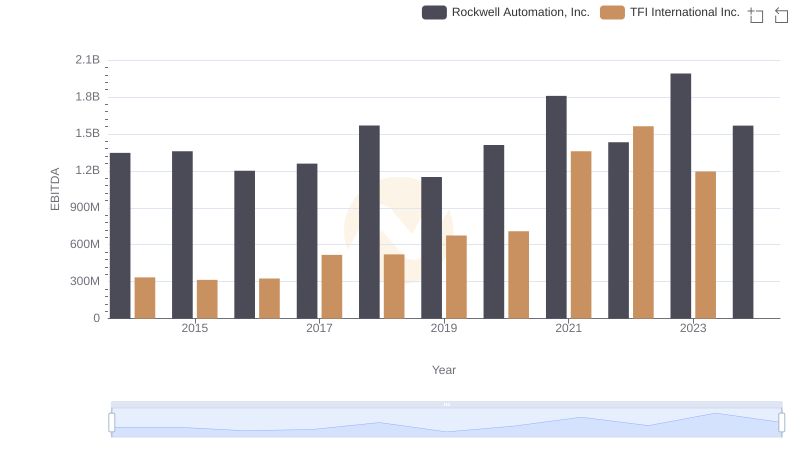
A Side-by-Side Analysis of EBITDA: Rockwell Automation, Inc. and TFI International Inc.
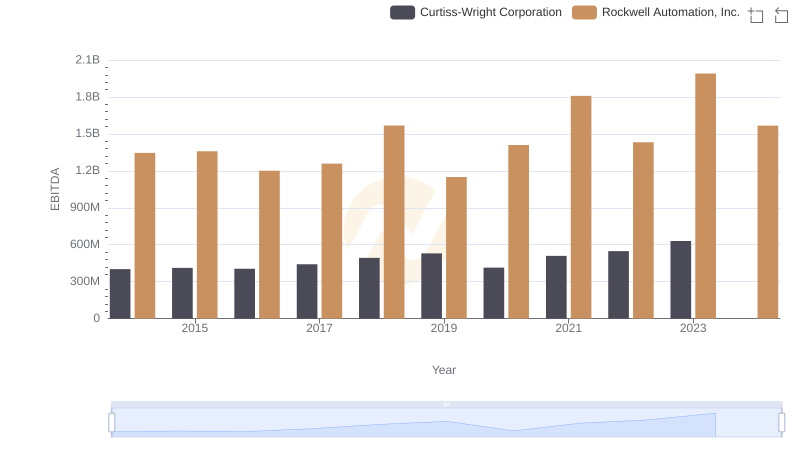
EBITDA Performance Review: Rockwell Automation, Inc. vs Curtiss-Wright Corporation
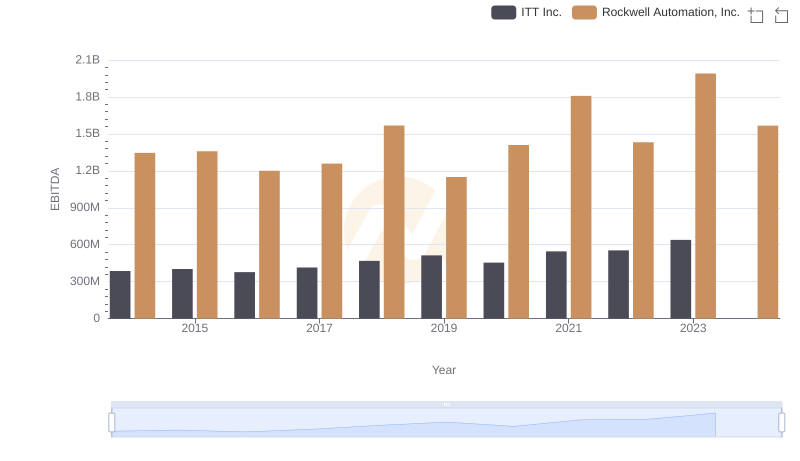
Rockwell Automation, Inc. vs ITT Inc.: In-Depth EBITDA Performance Comparison