| __timestamp | Rentokil Initial plc | Rockwell Automation, Inc. |
|---|---|---|
| Wednesday, January 1, 2014 | 1740800000 | 6623500000 |
| Thursday, January 1, 2015 | 1759000000 | 6307900000 |
| Friday, January 1, 2016 | 2168100000 | 5879500000 |
| Sunday, January 1, 2017 | 2412300000 | 6311300000 |
| Monday, January 1, 2018 | 2472300000 | 6666000000 |
| Tuesday, January 1, 2019 | 2676200000 | 6694800000 |
| Wednesday, January 1, 2020 | 2789400000 | 6329800000 |
| Friday, January 1, 2021 | 2953900000 | 6997400000 |
| Saturday, January 1, 2022 | 3714000000 | 7760400000 |
| Sunday, January 1, 2023 | 5375000000 | 9058000000 |
| Monday, January 1, 2024 | 8264200000 |
Infusing magic into the data realm
In the ever-evolving landscape of global business, Rockwell Automation, Inc. and Rentokil Initial plc stand as titans in their respective industries. Over the past decade, Rockwell Automation has consistently outpaced Rentokil Initial in revenue, showcasing a robust growth trajectory. From 2014 to 2023, Rockwell's revenue surged by approximately 37%, peaking at $9.06 billion in 2023. In contrast, Rentokil Initial experienced a remarkable 209% increase, reaching $5.38 billion in the same year.
This comparison highlights the dynamic nature of global markets and the diverse strategies companies employ to thrive.
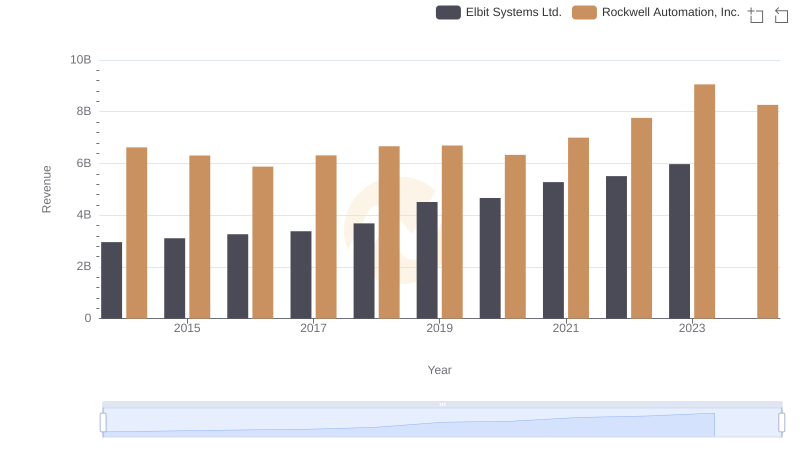
Revenue Showdown: Rockwell Automation, Inc. vs Elbit Systems Ltd.

Breaking Down Revenue Trends: Rockwell Automation, Inc. vs Curtiss-Wright Corporation
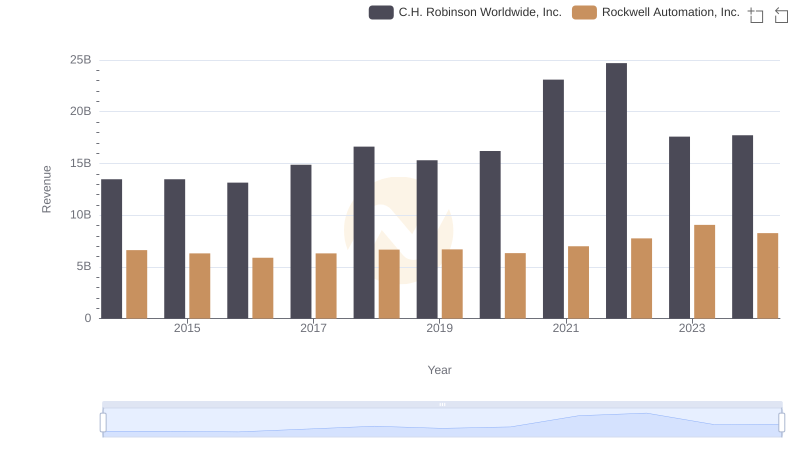
Rockwell Automation, Inc. vs C.H. Robinson Worldwide, Inc.: Annual Revenue Growth Compared
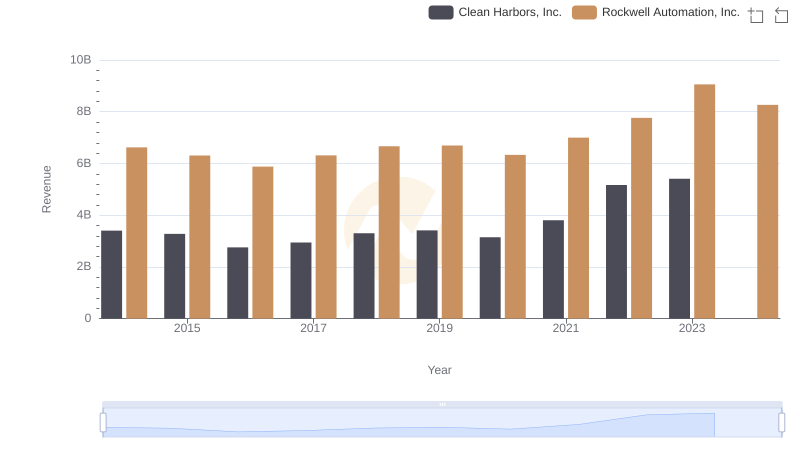
Comparing Revenue Performance: Rockwell Automation, Inc. or Clean Harbors, Inc.?
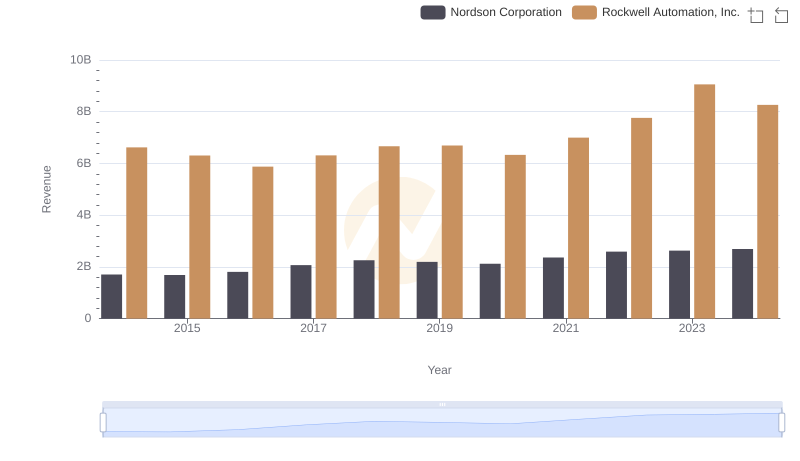
Annual Revenue Comparison: Rockwell Automation, Inc. vs Nordson Corporation
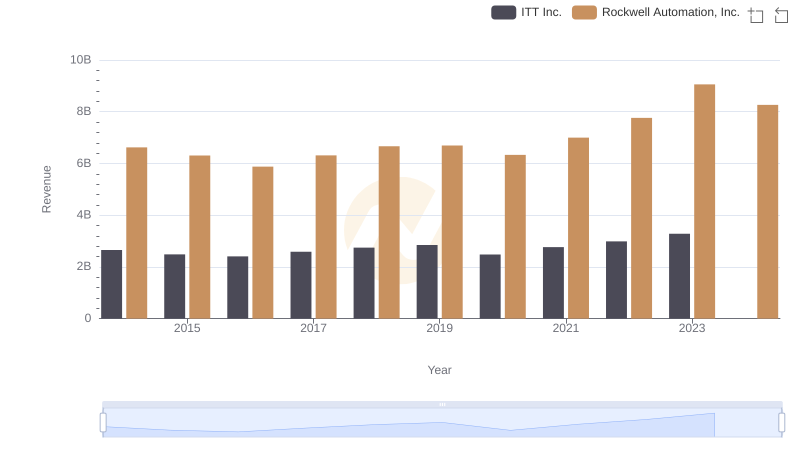
Comparing Revenue Performance: Rockwell Automation, Inc. or ITT Inc.?
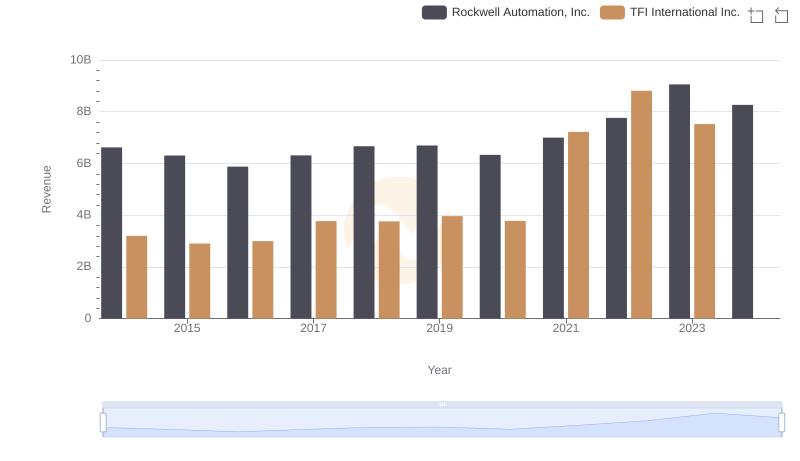
Breaking Down Revenue Trends: Rockwell Automation, Inc. vs TFI International Inc.
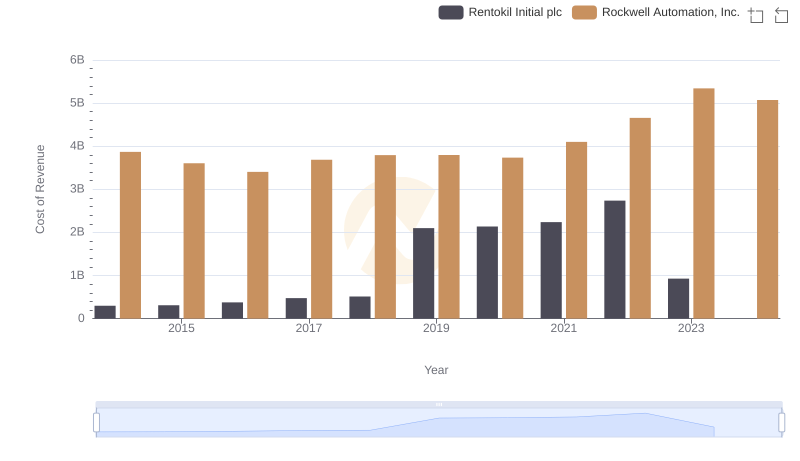
Cost Insights: Breaking Down Rockwell Automation, Inc. and Rentokil Initial plc's Expenses
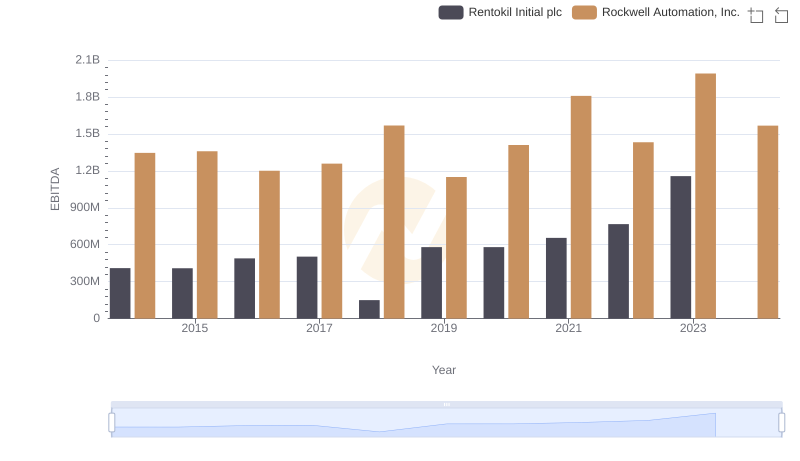
EBITDA Metrics Evaluated: Rockwell Automation, Inc. vs Rentokil Initial plc