| __timestamp | Elbit Systems Ltd. | Parker-Hannifin Corporation |
|---|---|---|
| Wednesday, January 1, 2014 | 2133151000 | 10188227000 |
| Thursday, January 1, 2015 | 2210528000 | 9655245000 |
| Friday, January 1, 2016 | 2300636000 | 8823384000 |
| Sunday, January 1, 2017 | 2379905000 | 9188962000 |
| Monday, January 1, 2018 | 2707505000 | 10762841000 |
| Tuesday, January 1, 2019 | 3371933000 | 10703484000 |
| Wednesday, January 1, 2020 | 3497465000 | 10286518000 |
| Friday, January 1, 2021 | 3920473000 | 10449680000 |
| Saturday, January 1, 2022 | 4138266000 | 11387267000 |
| Sunday, January 1, 2023 | 4491790000 | 12635892000 |
| Monday, January 1, 2024 | 12801816000 |
Unlocking the unknown
In the ever-evolving landscape of industrial and defense sectors, understanding cost dynamics is crucial. Parker-Hannifin Corporation, a leader in motion and control technologies, and Elbit Systems Ltd., a prominent defense electronics company, offer a fascinating study in cost of revenue trends from 2014 to 2023.
Parker-Hannifin consistently outpaces Elbit Systems in cost of revenue, reflecting its expansive operations. From 2014 to 2023, Parker-Hannifin's cost of revenue grew by approximately 24%, peaking at $12.6 billion in 2023. In contrast, Elbit Systems saw a 110% increase, reaching $4.5 billion in the same year. This stark difference highlights Parker-Hannifin's larger scale and Elbit's rapid growth trajectory.
While Parker-Hannifin's data extends into 2024, Elbit Systems' data for that year is unavailable, suggesting potential reporting delays or strategic shifts.
These trends underscore the diverse strategies and market conditions influencing these industry giants.
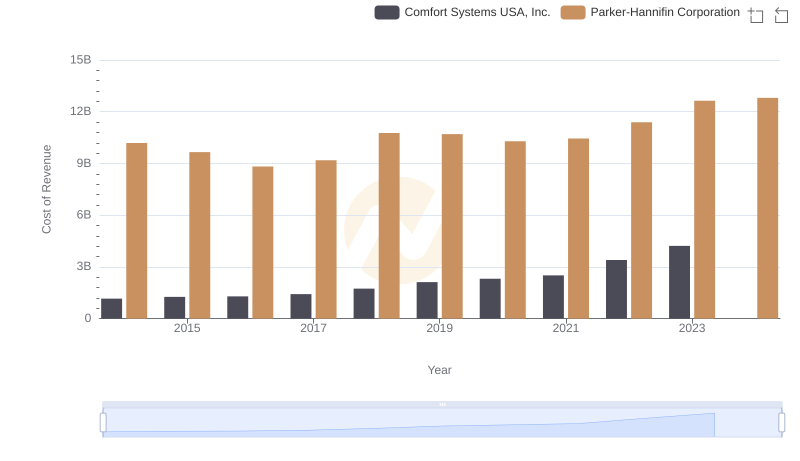
Cost of Revenue Comparison: Parker-Hannifin Corporation vs Comfort Systems USA, Inc.
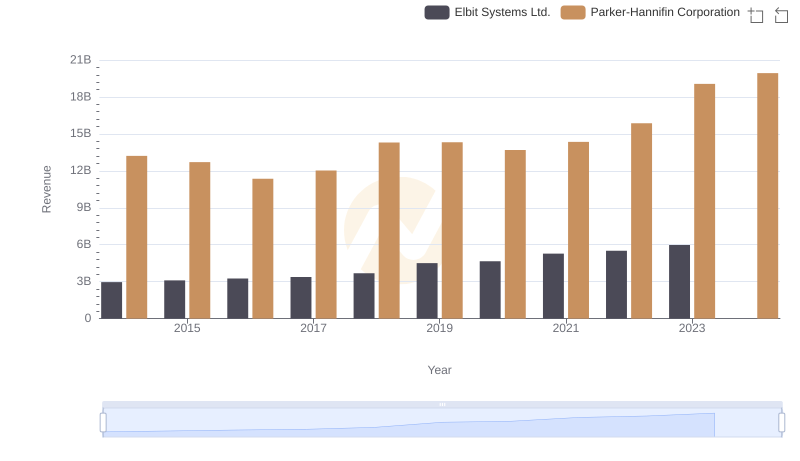
Comparing Revenue Performance: Parker-Hannifin Corporation or Elbit Systems Ltd.?
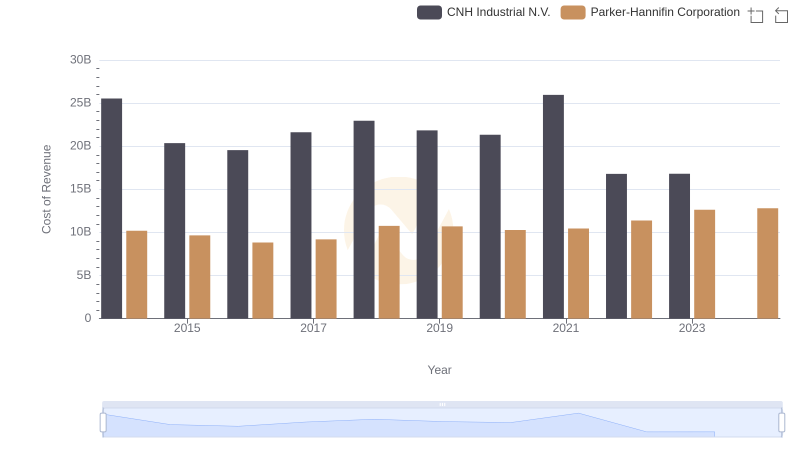
Analyzing Cost of Revenue: Parker-Hannifin Corporation and CNH Industrial N.V.
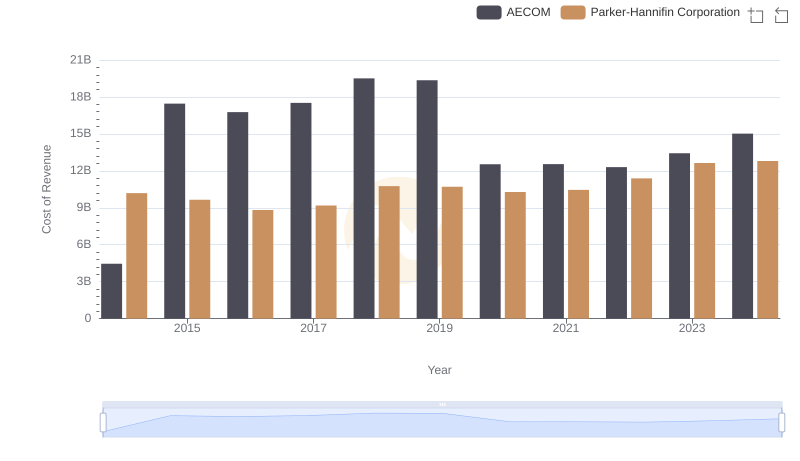
Comparing Cost of Revenue Efficiency: Parker-Hannifin Corporation vs AECOM
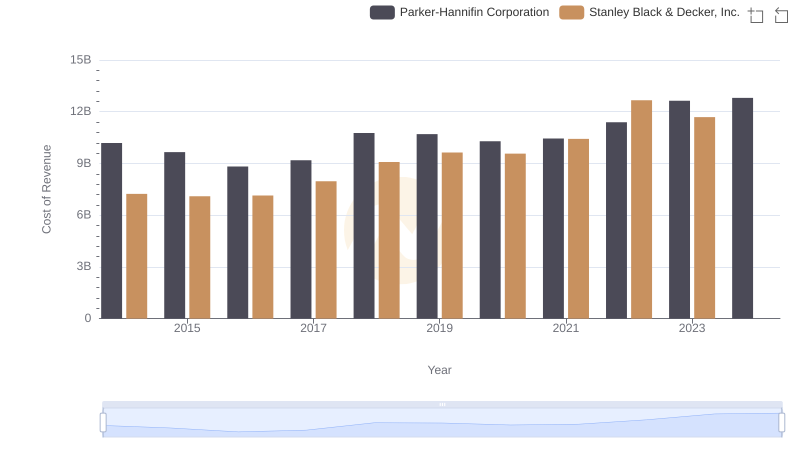
Analyzing Cost of Revenue: Parker-Hannifin Corporation and Stanley Black & Decker, Inc.
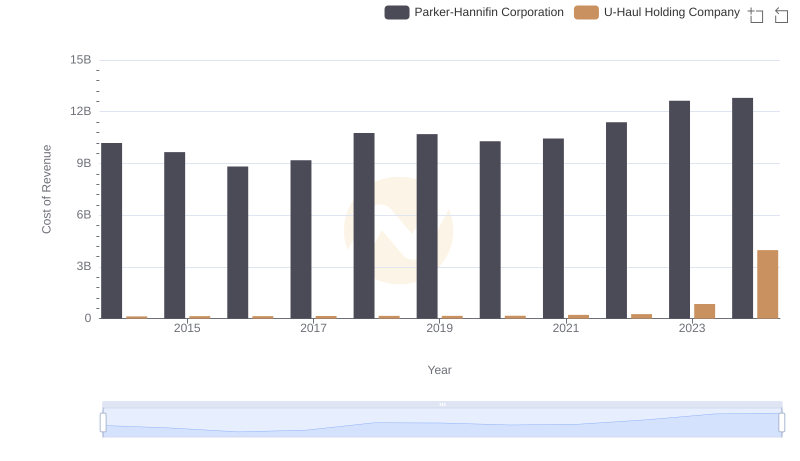
Cost Insights: Breaking Down Parker-Hannifin Corporation and U-Haul Holding Company's Expenses
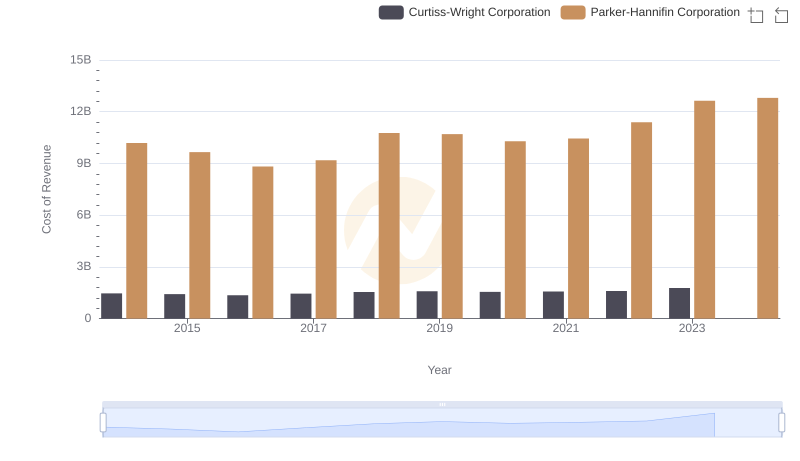
Analyzing Cost of Revenue: Parker-Hannifin Corporation and Curtiss-Wright Corporation
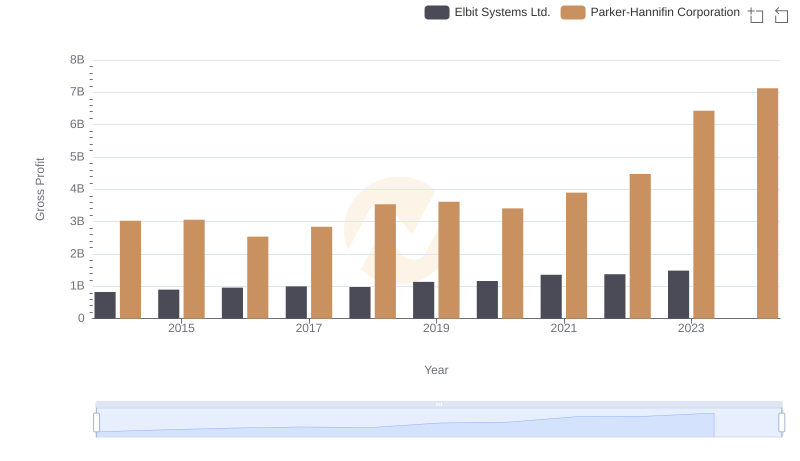
Gross Profit Trends Compared: Parker-Hannifin Corporation vs Elbit Systems Ltd.
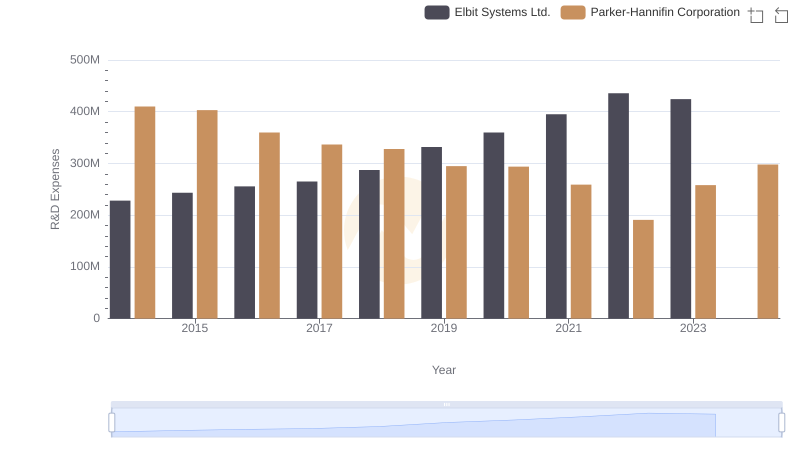
Parker-Hannifin Corporation vs Elbit Systems Ltd.: Strategic Focus on R&D Spending
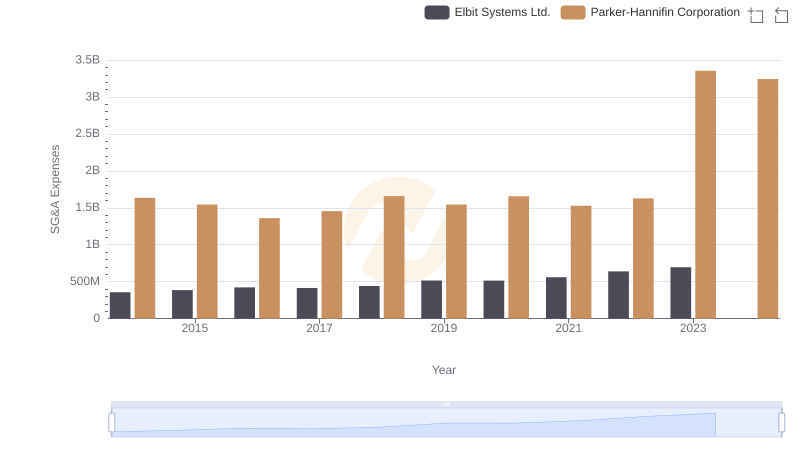
SG&A Efficiency Analysis: Comparing Parker-Hannifin Corporation and Elbit Systems Ltd.
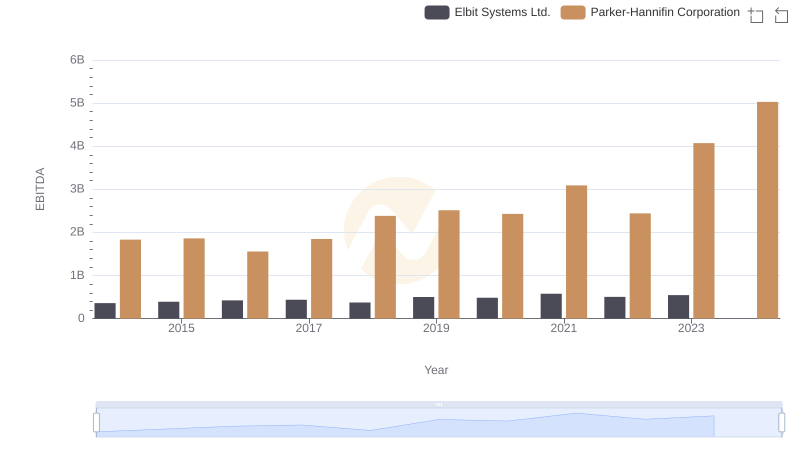
Comprehensive EBITDA Comparison: Parker-Hannifin Corporation vs Elbit Systems Ltd.