| __timestamp | Curtiss-Wright Corporation | Parker-Hannifin Corporation |
|---|---|---|
| Wednesday, January 1, 2014 | 1466610000 | 10188227000 |
| Thursday, January 1, 2015 | 1422428000 | 9655245000 |
| Friday, January 1, 2016 | 1358448000 | 8823384000 |
| Sunday, January 1, 2017 | 1452431000 | 9188962000 |
| Monday, January 1, 2018 | 1540574000 | 10762841000 |
| Tuesday, January 1, 2019 | 1589216000 | 10703484000 |
| Wednesday, January 1, 2020 | 1550109000 | 10286518000 |
| Friday, January 1, 2021 | 1572575000 | 10449680000 |
| Saturday, January 1, 2022 | 1602416000 | 11387267000 |
| Sunday, January 1, 2023 | 1778195000 | 12635892000 |
| Monday, January 1, 2024 | 1967640000 | 12801816000 |
Data in motion
In the competitive landscape of industrial manufacturing, Parker-Hannifin Corporation and Curtiss-Wright Corporation stand as titans. Over the past decade, Parker-Hannifin has consistently outpaced Curtiss-Wright in terms of cost of revenue, with figures peaking at approximately $12.8 billion in 2024, a 45% increase from 2016. Meanwhile, Curtiss-Wright's cost of revenue saw a more modest rise, reaching around $1.78 billion in 2023, marking a 31% growth since 2016. This divergence highlights Parker-Hannifin's expansive operations and market reach. However, the data for 2024 is incomplete for Curtiss-Wright, leaving room for speculation on its future trajectory. As these corporations navigate the evolving industrial landscape, their financial strategies will be pivotal in shaping their competitive edge.
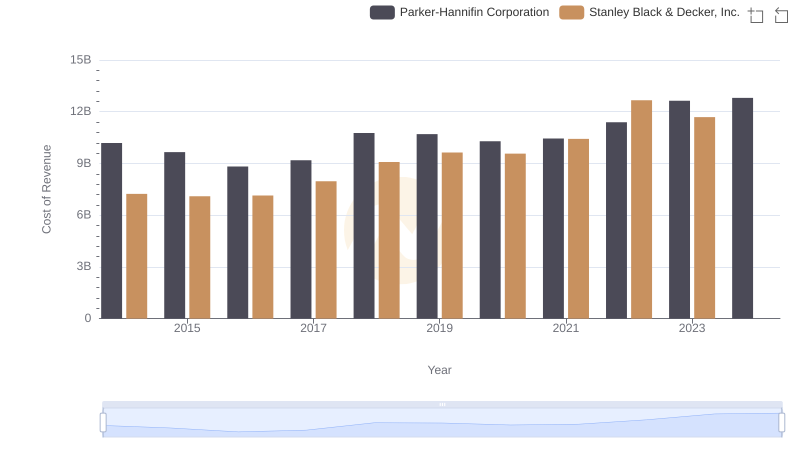
Analyzing Cost of Revenue: Parker-Hannifin Corporation and Stanley Black & Decker, Inc.
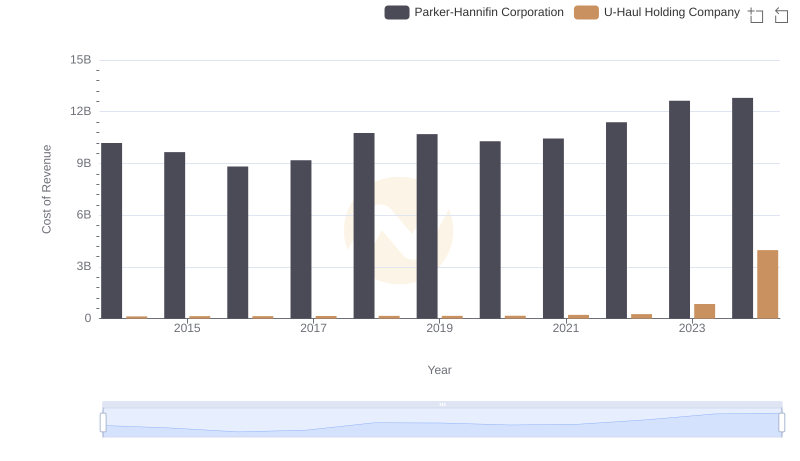
Cost Insights: Breaking Down Parker-Hannifin Corporation and U-Haul Holding Company's Expenses
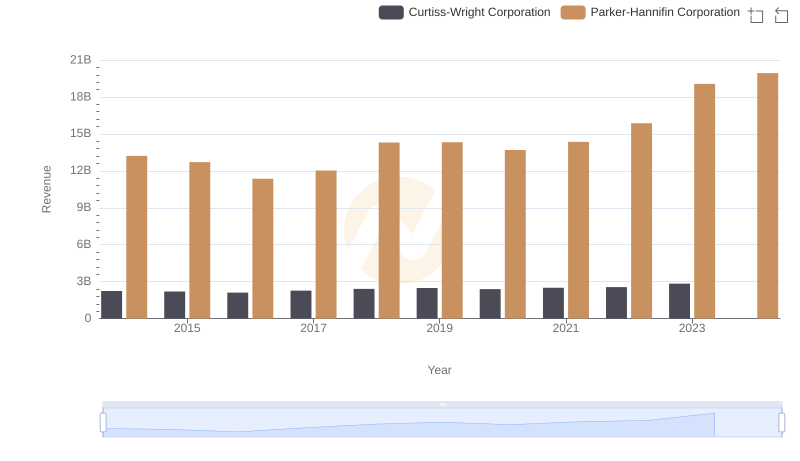
Parker-Hannifin Corporation or Curtiss-Wright Corporation: Who Leads in Yearly Revenue?
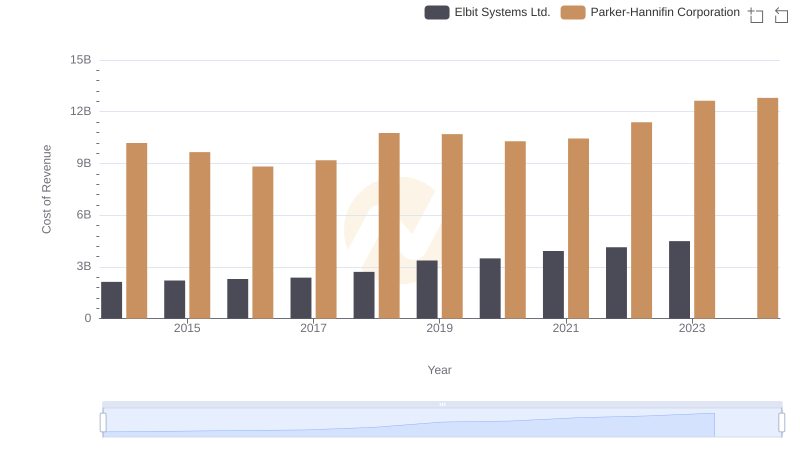
Cost of Revenue Trends: Parker-Hannifin Corporation vs Elbit Systems Ltd.
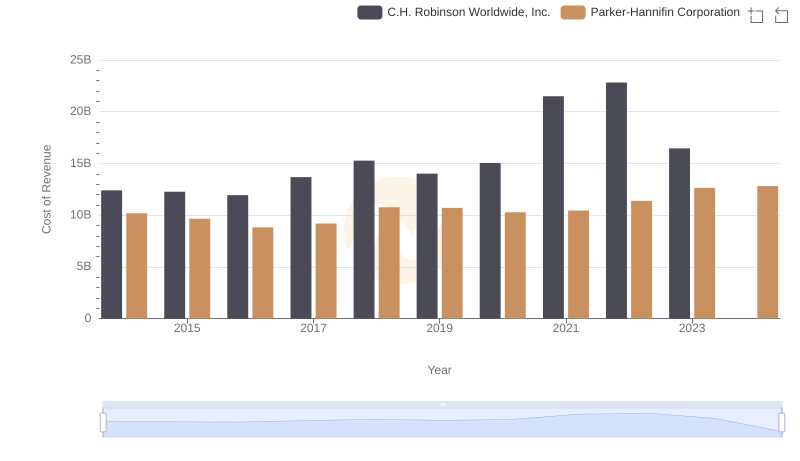
Cost of Revenue Trends: Parker-Hannifin Corporation vs C.H. Robinson Worldwide, Inc.
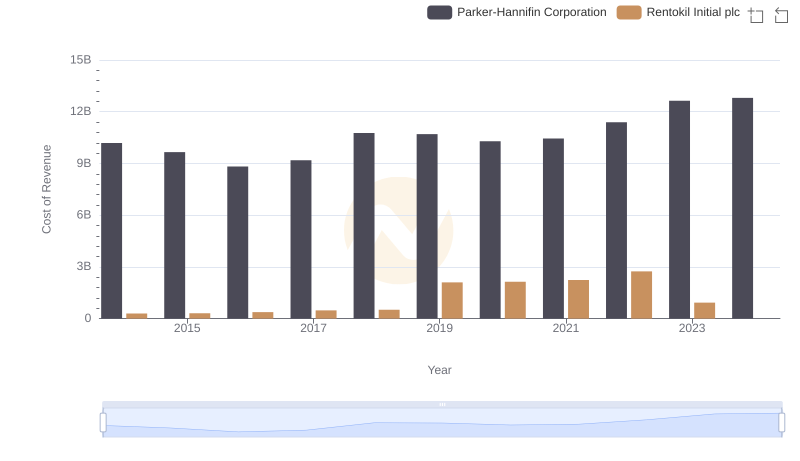
Analyzing Cost of Revenue: Parker-Hannifin Corporation and Rentokil Initial plc
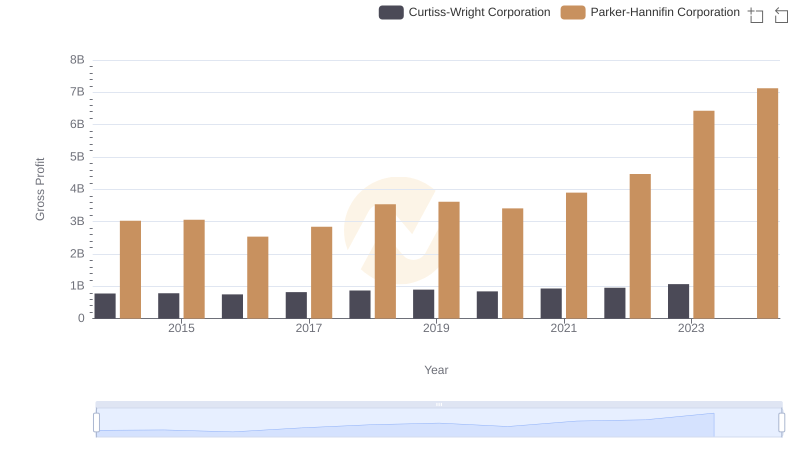
Who Generates Higher Gross Profit? Parker-Hannifin Corporation or Curtiss-Wright Corporation
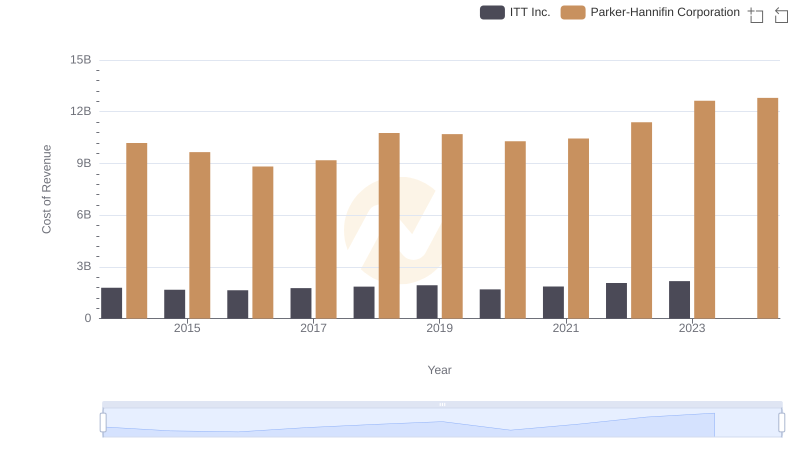
Cost of Revenue Trends: Parker-Hannifin Corporation vs ITT Inc.
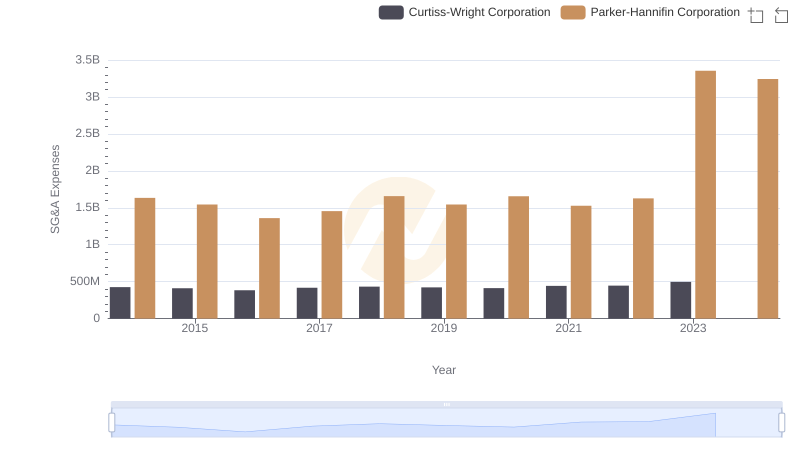
Operational Costs Compared: SG&A Analysis of Parker-Hannifin Corporation and Curtiss-Wright Corporation
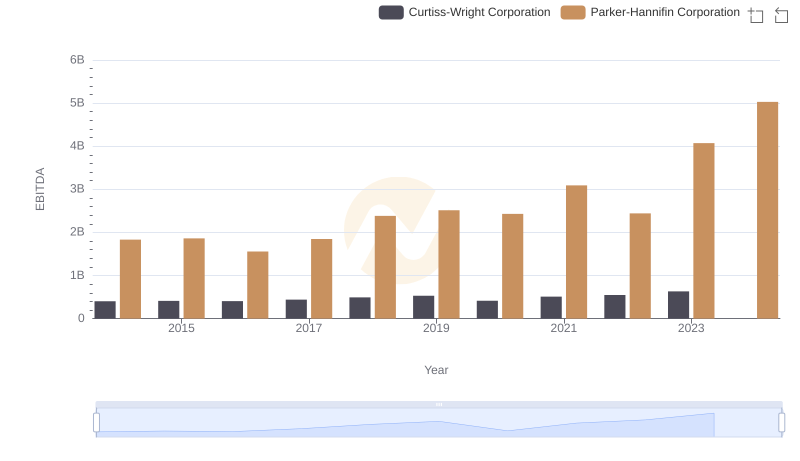
EBITDA Performance Review: Parker-Hannifin Corporation vs Curtiss-Wright Corporation