| __timestamp | Intuit Inc. | Teledyne Technologies Incorporated |
|---|---|---|
| Wednesday, January 1, 2014 | 668000000 | 1487100000 |
| Thursday, January 1, 2015 | 725000000 | 1427800000 |
| Friday, January 1, 2016 | 752000000 | 1308800000 |
| Sunday, January 1, 2017 | 809000000 | 1612200000 |
| Monday, January 1, 2018 | 977000000 | 1791000000 |
| Tuesday, January 1, 2019 | 1167000000 | 1920300000 |
| Wednesday, January 1, 2020 | 1378000000 | 1905300000 |
| Friday, January 1, 2021 | 1683000000 | 2772900000 |
| Saturday, January 1, 2022 | 2406000000 | 3128300000 |
| Sunday, January 1, 2023 | 3143000000 | 3196100000 |
| Monday, January 1, 2024 | 3465000000 |
Infusing magic into the data realm
In the ever-evolving landscape of corporate finance, understanding cost efficiency is paramount. This analysis delves into the cost of revenue trends for Intuit Inc. and Teledyne Technologies Incorporated from 2014 to 2023. Over this decade, Intuit Inc. has seen a staggering 418% increase in its cost of revenue, peaking at $3.47 billion in 2023. Meanwhile, Teledyne Technologies experienced a 115% rise, reaching $3.20 billion in the same year.
This comparative analysis highlights the dynamic nature of cost management in two leading corporations, offering valuable insights for investors and analysts alike.
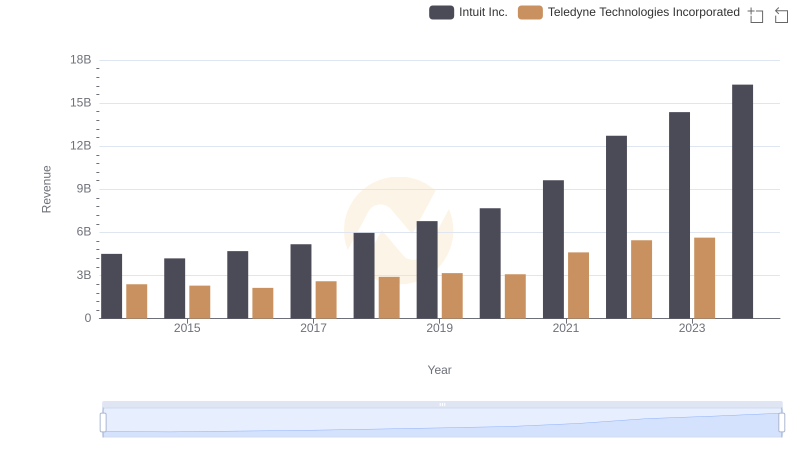
Annual Revenue Comparison: Intuit Inc. vs Teledyne Technologies Incorporated
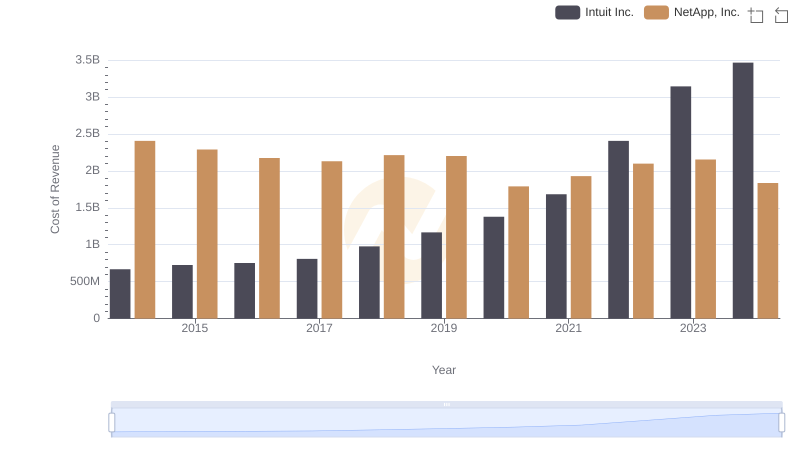
Comparing Cost of Revenue Efficiency: Intuit Inc. vs NetApp, Inc.
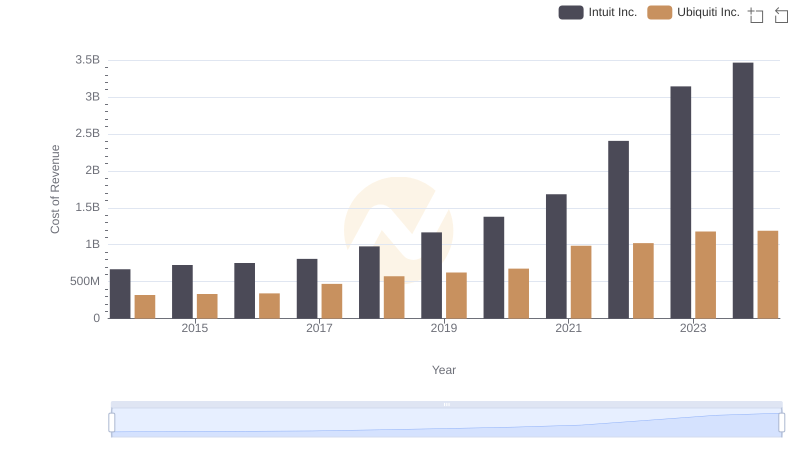
Cost of Revenue Comparison: Intuit Inc. vs Ubiquiti Inc.
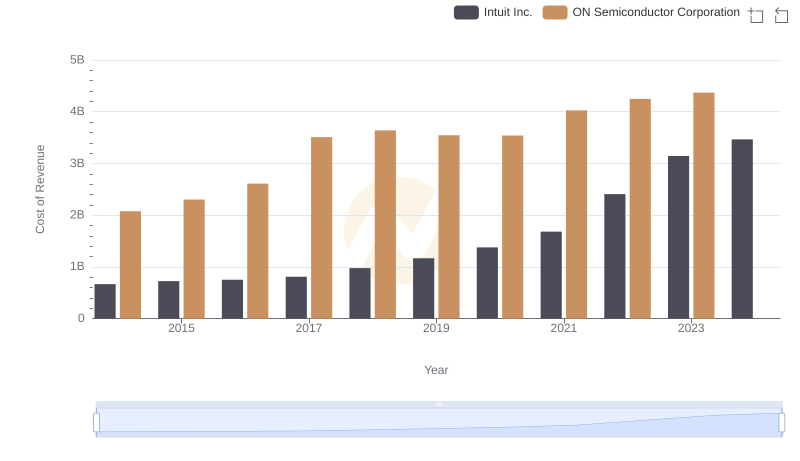
Comparing Cost of Revenue Efficiency: Intuit Inc. vs ON Semiconductor Corporation
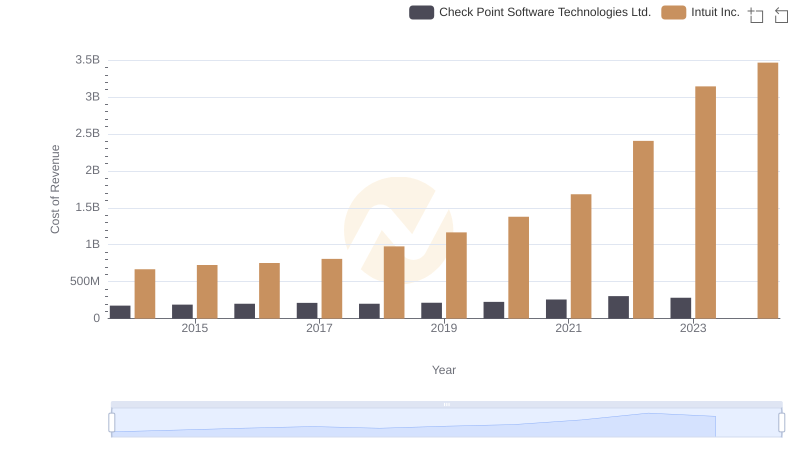
Comparing Cost of Revenue Efficiency: Intuit Inc. vs Check Point Software Technologies Ltd.
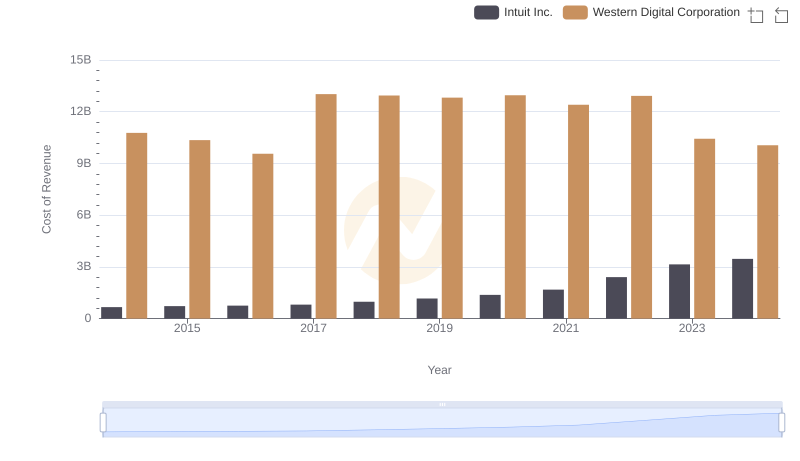
Cost of Revenue Trends: Intuit Inc. vs Western Digital Corporation
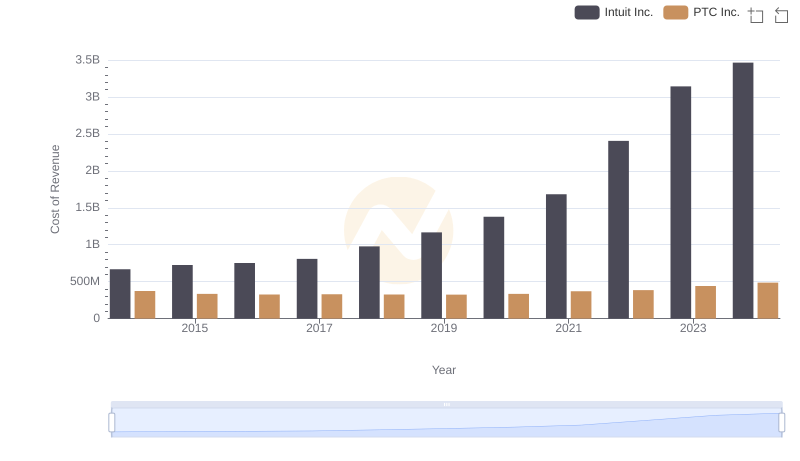
Cost of Revenue: Key Insights for Intuit Inc. and PTC Inc.
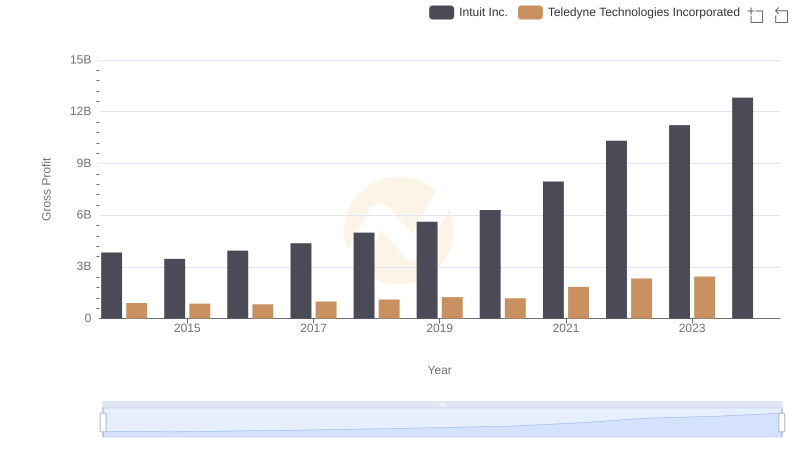
Intuit Inc. vs Teledyne Technologies Incorporated: A Gross Profit Performance Breakdown
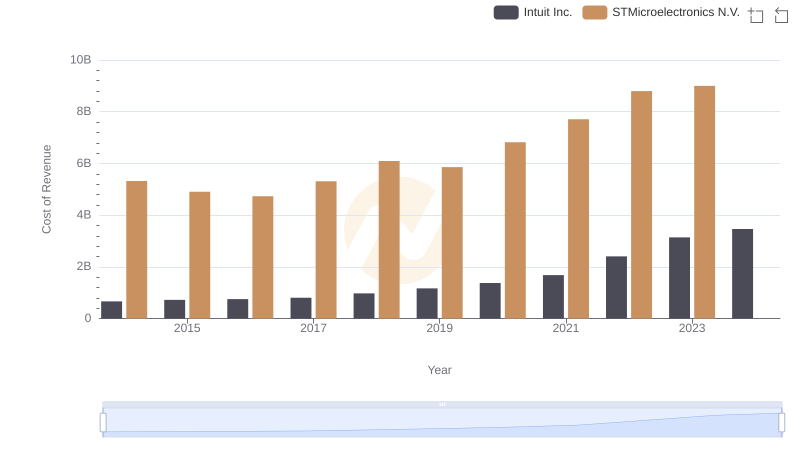
Cost Insights: Breaking Down Intuit Inc. and STMicroelectronics N.V.'s Expenses

Analyzing R&D Budgets: Intuit Inc. vs Teledyne Technologies Incorporated
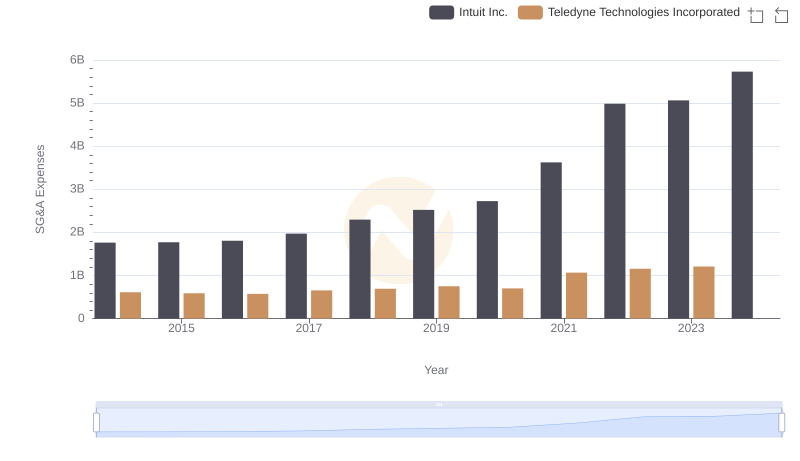
Breaking Down SG&A Expenses: Intuit Inc. vs Teledyne Technologies Incorporated

Intuit Inc. and Teledyne Technologies Incorporated: A Detailed Examination of EBITDA Performance