| __timestamp | Check Point Software Technologies Ltd. | Intuit Inc. |
|---|---|---|
| Wednesday, January 1, 2014 | 176541000 | 668000000 |
| Thursday, January 1, 2015 | 189057000 | 725000000 |
| Friday, January 1, 2016 | 202003000 | 752000000 |
| Sunday, January 1, 2017 | 212963000 | 809000000 |
| Monday, January 1, 2018 | 201379000 | 977000000 |
| Tuesday, January 1, 2019 | 215400000 | 1167000000 |
| Wednesday, January 1, 2020 | 226500000 | 1378000000 |
| Friday, January 1, 2021 | 258100000 | 1683000000 |
| Saturday, January 1, 2022 | 304400000 | 2406000000 |
| Sunday, January 1, 2023 | 282600000 | 3143000000 |
| Monday, January 1, 2024 | 3465000000 |
Cracking the code
In the ever-evolving landscape of technology, cost efficiency remains a pivotal factor for success. This analysis delves into the cost of revenue trends for Intuit Inc. and Check Point Software Technologies Ltd. over the past decade. From 2014 to 2023, Intuit Inc. has demonstrated a significant upward trajectory, with its cost of revenue increasing by approximately 370%, reaching a peak in 2023. In contrast, Check Point Software Technologies Ltd. has maintained a more stable cost structure, with a modest increase of around 60% over the same period.
The data reveals that Intuit's cost of revenue surged notably in 2022, marking a 43% rise from the previous year, while Check Point's costs peaked in 2022 before slightly declining in 2023. This comparison highlights the contrasting strategies of these two tech giants, offering valuable insights into their operational efficiencies and market positioning.
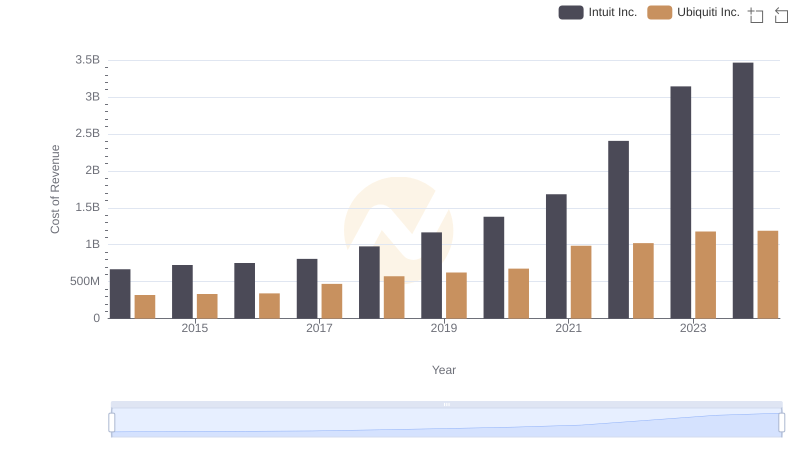
Cost of Revenue Comparison: Intuit Inc. vs Ubiquiti Inc.
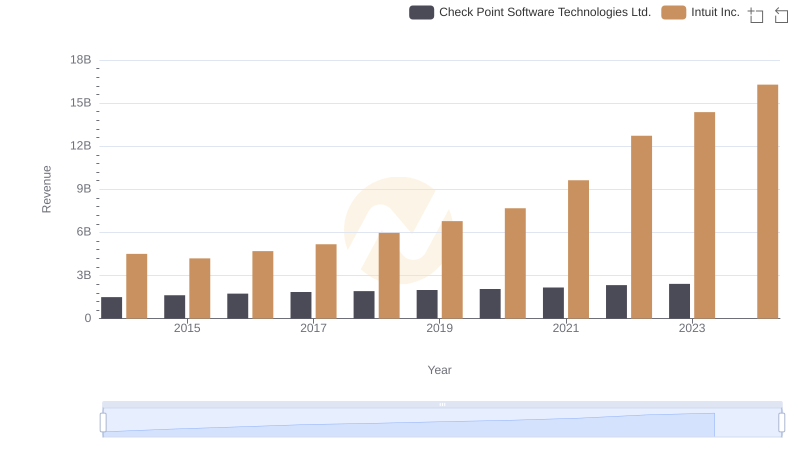
Intuit Inc. and Check Point Software Technologies Ltd.: A Comprehensive Revenue Analysis
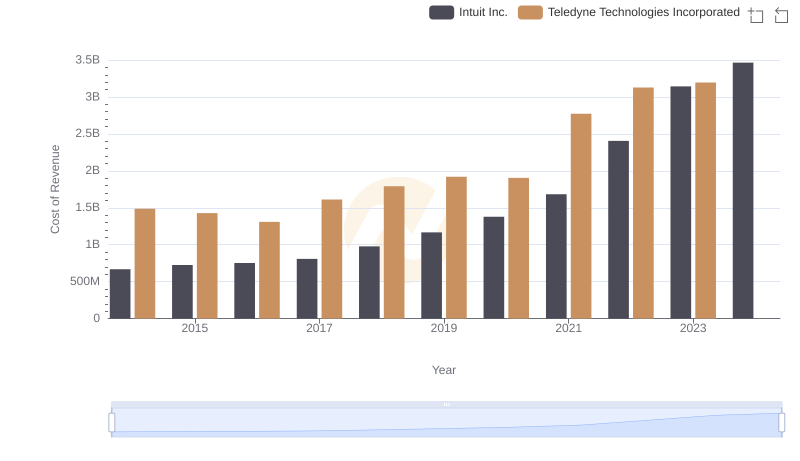
Intuit Inc. vs Teledyne Technologies Incorporated: Efficiency in Cost of Revenue Explored
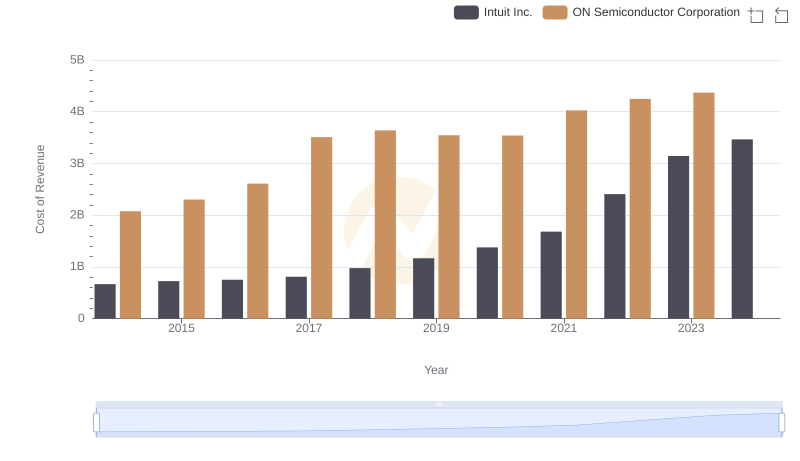
Comparing Cost of Revenue Efficiency: Intuit Inc. vs ON Semiconductor Corporation
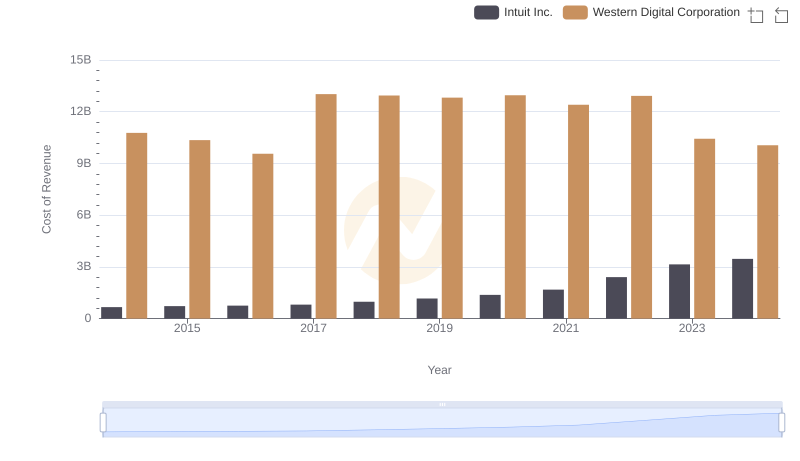
Cost of Revenue Trends: Intuit Inc. vs Western Digital Corporation
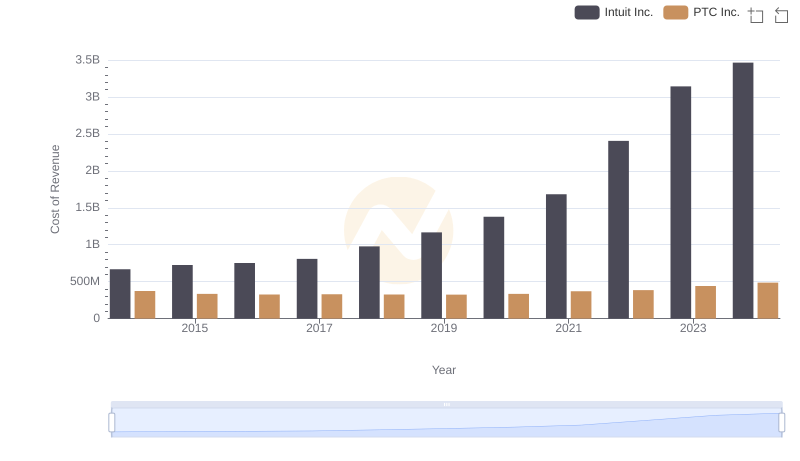
Cost of Revenue: Key Insights for Intuit Inc. and PTC Inc.
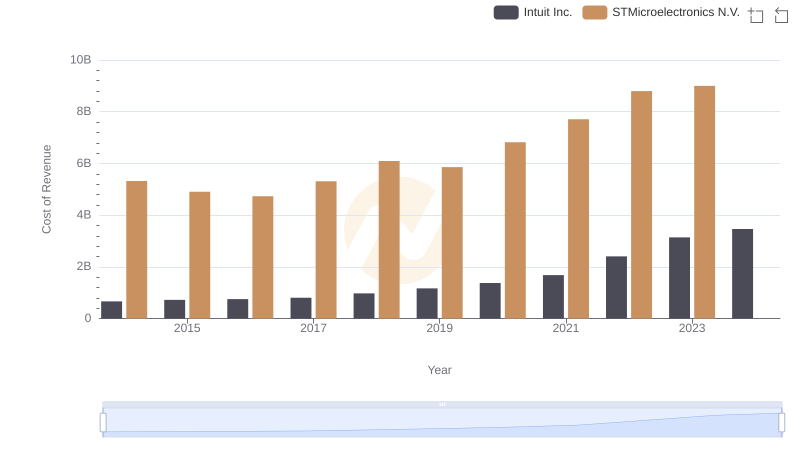
Cost Insights: Breaking Down Intuit Inc. and STMicroelectronics N.V.'s Expenses
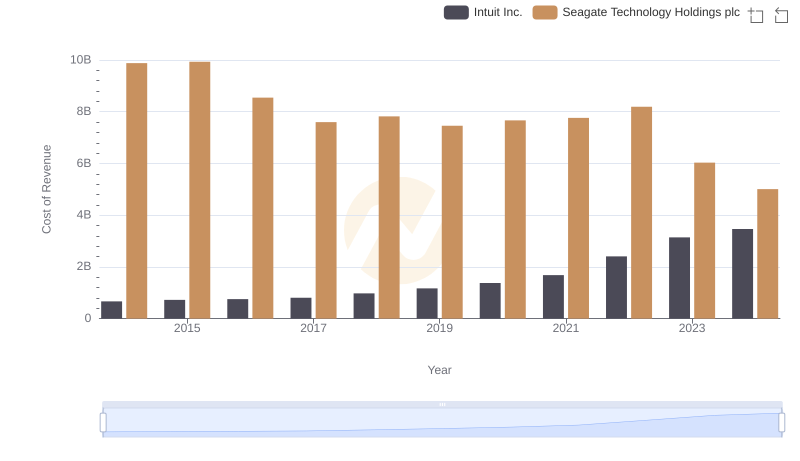
Cost Insights: Breaking Down Intuit Inc. and Seagate Technology Holdings plc's Expenses
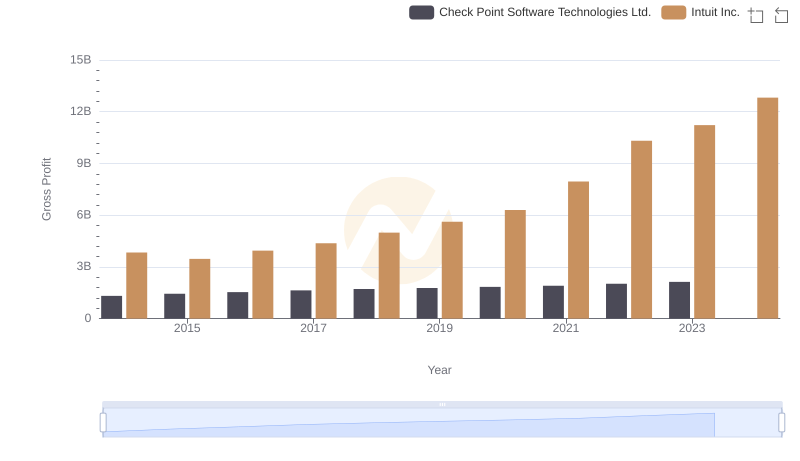
Who Generates Higher Gross Profit? Intuit Inc. or Check Point Software Technologies Ltd.
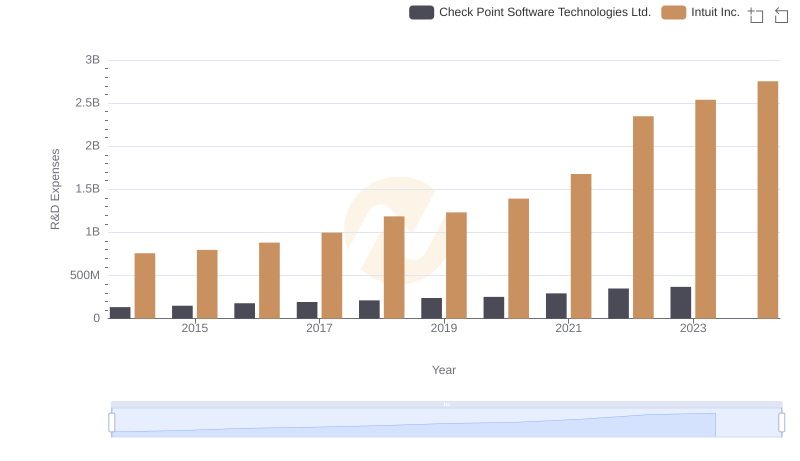
R&D Spending Showdown: Intuit Inc. vs Check Point Software Technologies Ltd.
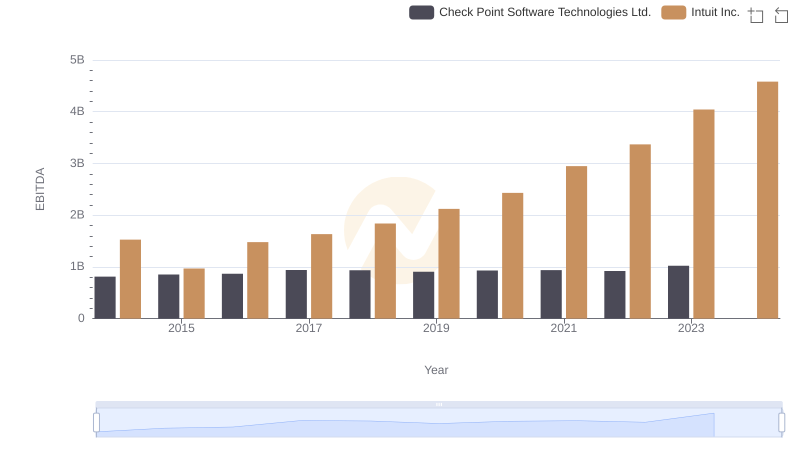
Professional EBITDA Benchmarking: Intuit Inc. vs Check Point Software Technologies Ltd.