| __timestamp | C.H. Robinson Worldwide, Inc. | Ingersoll Rand Inc. |
|---|---|---|
| Wednesday, January 1, 2014 | 320213000 | 476000000 |
| Thursday, January 1, 2015 | 358760000 | 427000000 |
| Friday, January 1, 2016 | 375061000 | 414339000 |
| Sunday, January 1, 2017 | 413404000 | 446600000 |
| Monday, January 1, 2018 | 449610000 | 434600000 |
| Tuesday, January 1, 2019 | 497806000 | 436400000 |
| Wednesday, January 1, 2020 | 496122000 | 894800000 |
| Friday, January 1, 2021 | 526371000 | 1028000000 |
| Saturday, January 1, 2022 | 603415000 | 1095800000 |
| Sunday, January 1, 2023 | 624266000 | 1272700000 |
| Monday, January 1, 2024 | 639624000 | 0 |
Infusing magic into the data realm
In the ever-evolving landscape of corporate finance, understanding the nuances of Selling, General, and Administrative (SG&A) expenses is crucial. Over the past decade, Ingersoll Rand Inc. and C.H. Robinson Worldwide, Inc. have demonstrated contrasting trends in their SG&A expenditures. From 2014 to 2023, Ingersoll Rand's SG&A expenses surged by approximately 167%, peaking in 2023. This significant increase reflects strategic investments and potential expansions. In contrast, C.H. Robinson's expenses grew by about 100% over the same period, indicating a more conservative approach. Notably, 2020 marked a pivotal year for Ingersoll Rand, with expenses nearly doubling, possibly due to restructuring or acquisitions. As we look to 2024, data for Ingersoll Rand is missing, leaving room for speculation on future strategies. This analysis underscores the importance of SG&A management in shaping corporate trajectories.
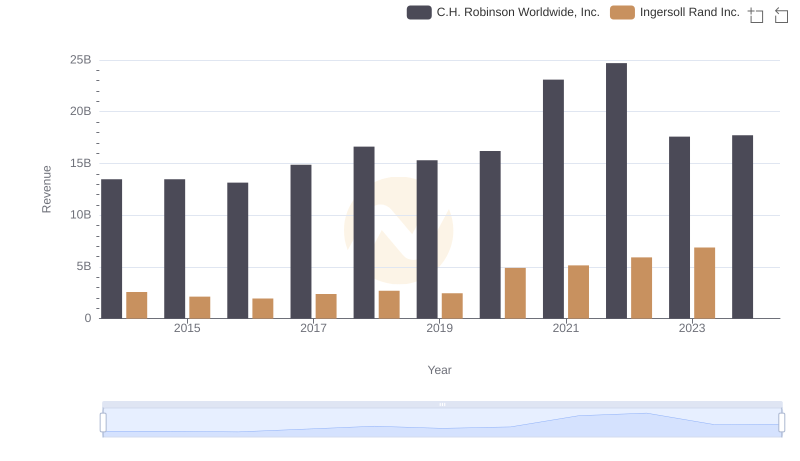
Comparing Revenue Performance: Ingersoll Rand Inc. or C.H. Robinson Worldwide, Inc.?
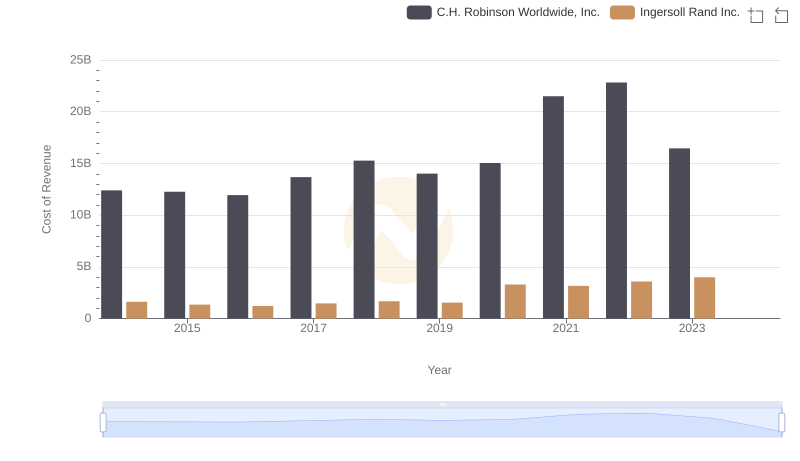
Cost Insights: Breaking Down Ingersoll Rand Inc. and C.H. Robinson Worldwide, Inc.'s Expenses
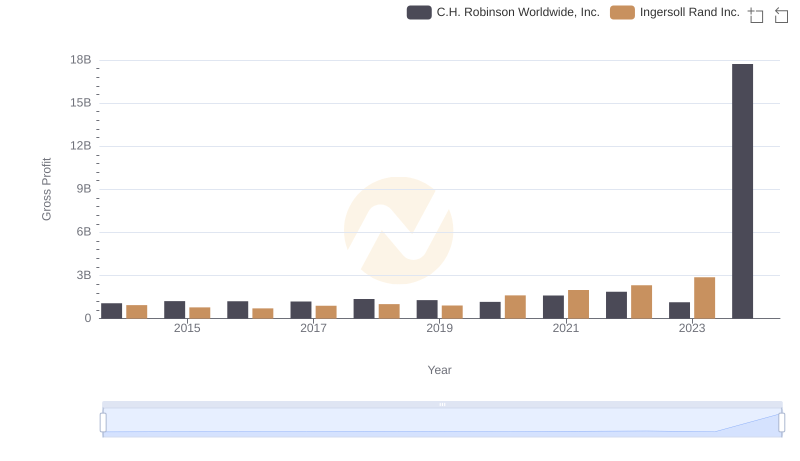
Ingersoll Rand Inc. and C.H. Robinson Worldwide, Inc.: A Detailed Gross Profit Analysis
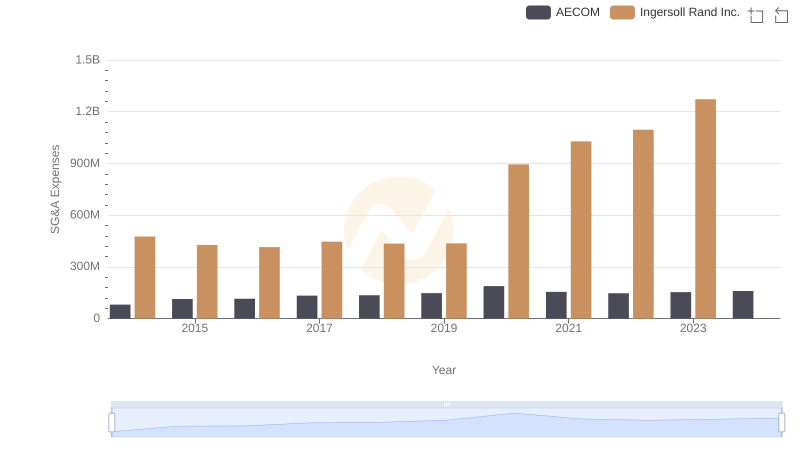
Ingersoll Rand Inc. or AECOM: Who Manages SG&A Costs Better?
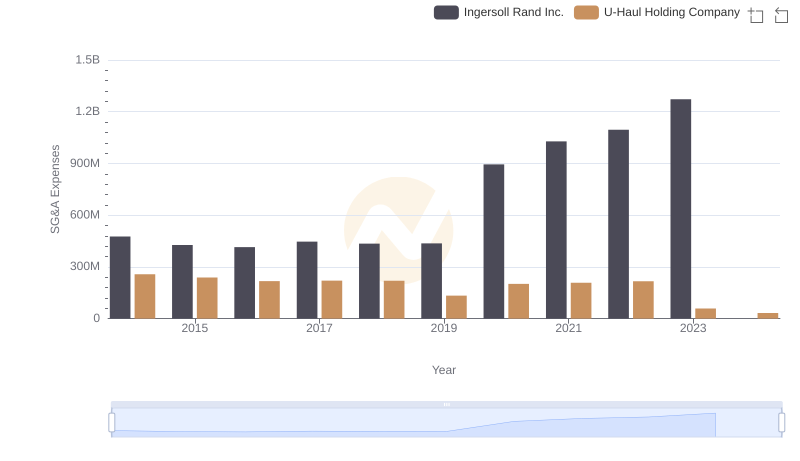
SG&A Efficiency Analysis: Comparing Ingersoll Rand Inc. and U-Haul Holding Company
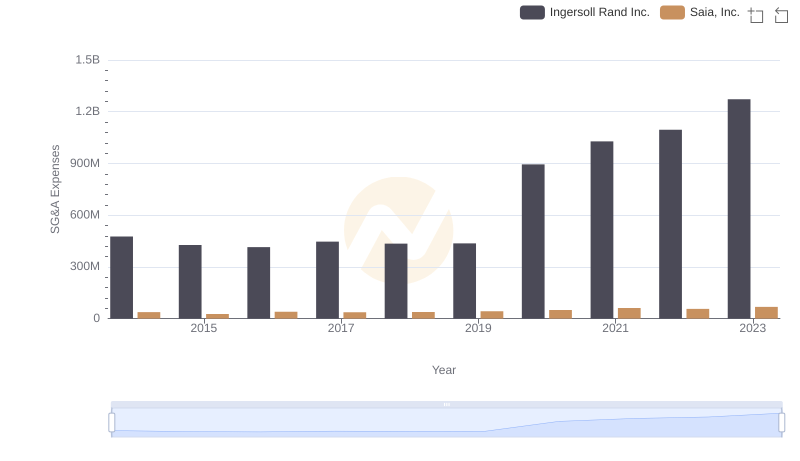
SG&A Efficiency Analysis: Comparing Ingersoll Rand Inc. and Saia, Inc.
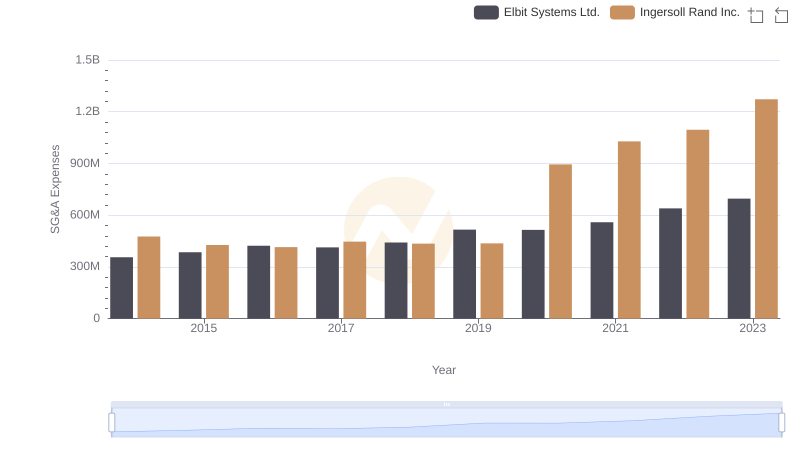
SG&A Efficiency Analysis: Comparing Ingersoll Rand Inc. and Elbit Systems Ltd.
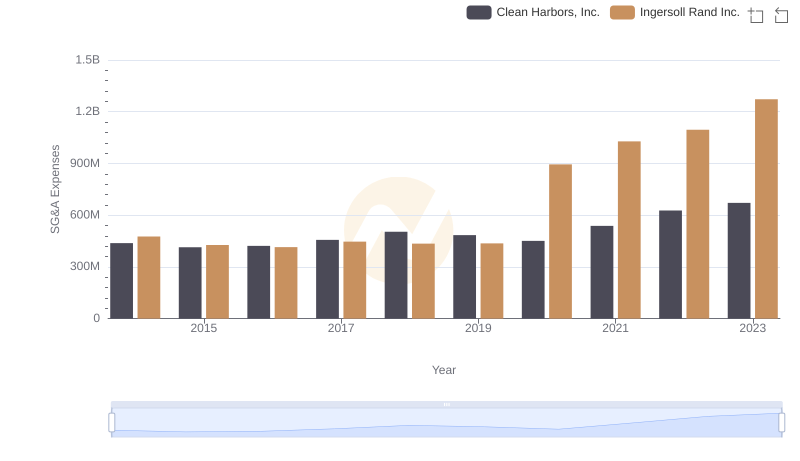
Ingersoll Rand Inc. vs Clean Harbors, Inc.: SG&A Expense Trends
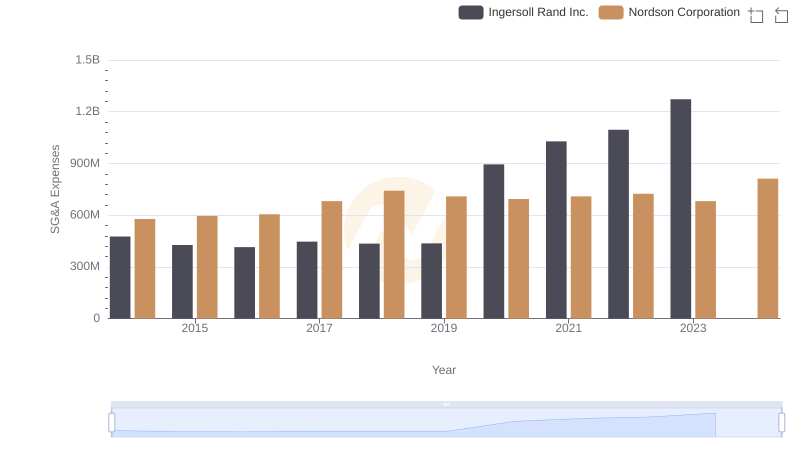
Breaking Down SG&A Expenses: Ingersoll Rand Inc. vs Nordson Corporation