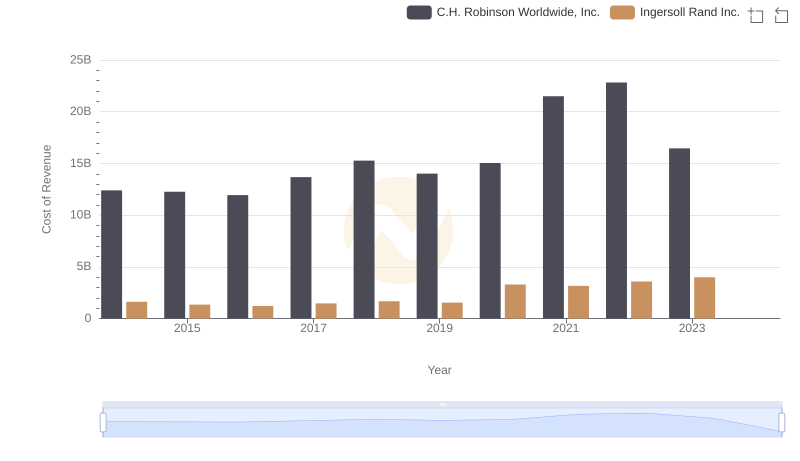
| __timestamp | C.H. Robinson Worldwide, Inc. | Ingersoll Rand Inc. |
|---|---|---|
| Wednesday, January 1, 2014 | 13470067000 | 2570005000 |
| Thursday, January 1, 2015 | 13476084000 | 2126900000 |
| Friday, January 1, 2016 | 13144413000 | 1939436000 |
| Sunday, January 1, 2017 | 14869380000 | 2375400000 |
| Monday, January 1, 2018 | 16631172000 | 2689800000 |
| Tuesday, January 1, 2019 | 15309508000 | 2451900000 |
| Wednesday, January 1, 2020 | 16207106000 | 4910200000 |
| Friday, January 1, 2021 | 23102138000 | 5152400000 |
| Saturday, January 1, 2022 | 24696625000 | 5916300000 |
| Sunday, January 1, 2023 | 17596443000 | 6876100000 |
| Monday, January 1, 2024 | 17724956000 | 0 |
Igniting the spark of knowledge
In the competitive landscape of American industry, Ingersoll Rand Inc. and C.H. Robinson Worldwide, Inc. have showcased distinct revenue trajectories over the past decade. From 2014 to 2023, C.H. Robinson, a leader in logistics, consistently outperformed Ingersoll Rand, a stalwart in industrial manufacturing, in terms of revenue. Notably, C.H. Robinson's revenue peaked in 2022, reaching nearly 25% higher than its 2014 figures, before experiencing a slight dip in 2023. Meanwhile, Ingersoll Rand demonstrated a steady growth pattern, with its revenue in 2023 almost tripling from its 2014 baseline. This divergence highlights the resilience and adaptability of these companies in their respective sectors. However, the absence of data for Ingersoll Rand in 2024 leaves room for speculation about its future trajectory. As these giants continue to evolve, their financial performances offer valuable insights into the broader economic trends shaping their industries.

Ingersoll Rand Inc. vs AECOM: Examining Key Revenue Metrics
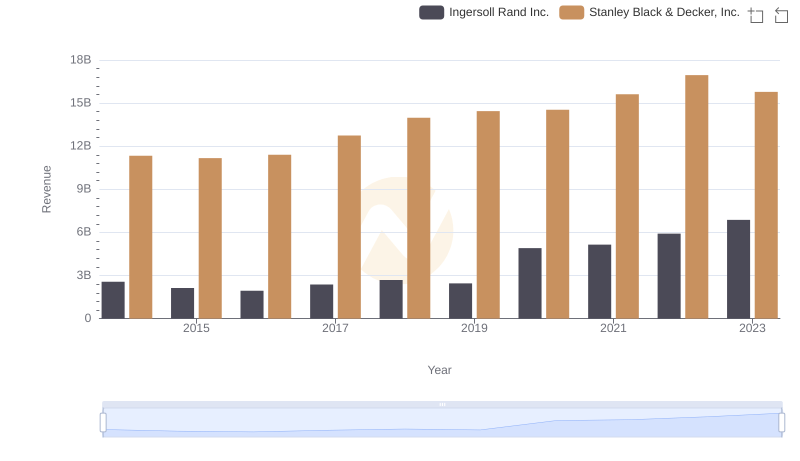
Ingersoll Rand Inc. or Stanley Black & Decker, Inc.: Who Leads in Yearly Revenue?
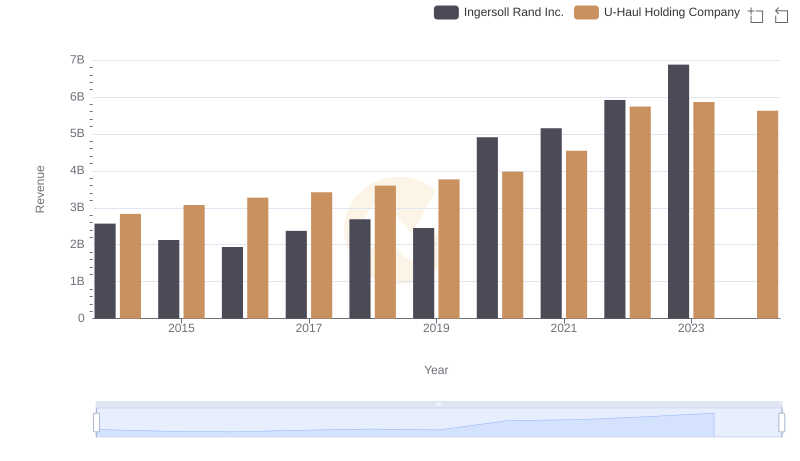
Revenue Showdown: Ingersoll Rand Inc. vs U-Haul Holding Company
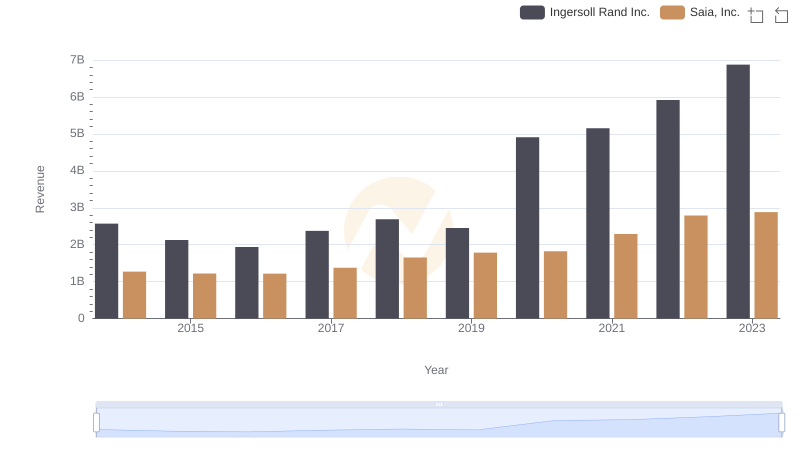
Ingersoll Rand Inc. and Saia, Inc.: A Comprehensive Revenue Analysis
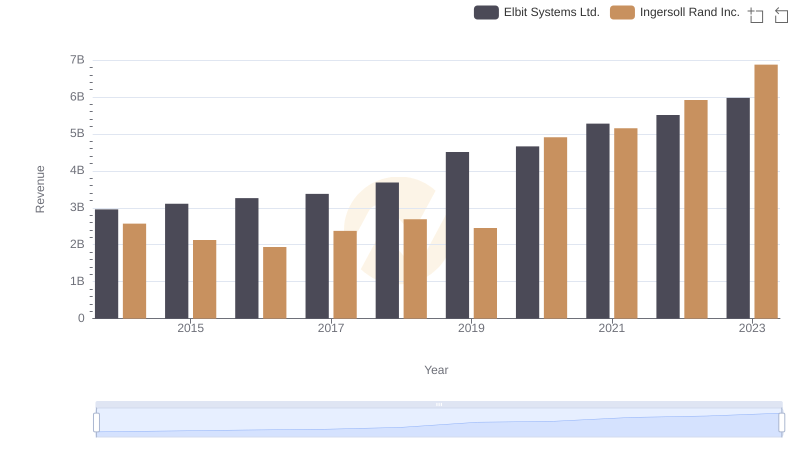
Comparing Revenue Performance: Ingersoll Rand Inc. or Elbit Systems Ltd.?
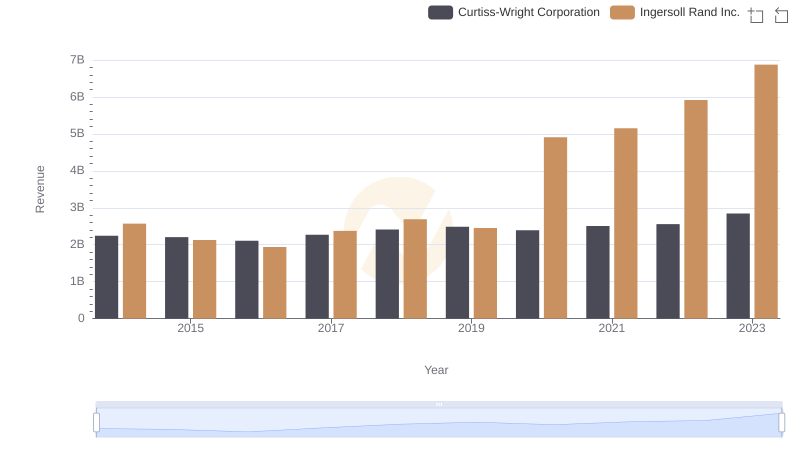
Ingersoll Rand Inc. or Curtiss-Wright Corporation: Who Leads in Yearly Revenue?
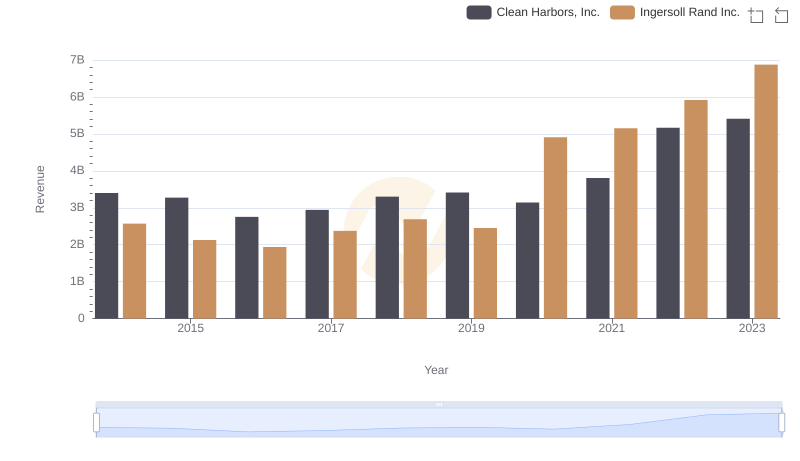
Comparing Revenue Performance: Ingersoll Rand Inc. or Clean Harbors, Inc.?
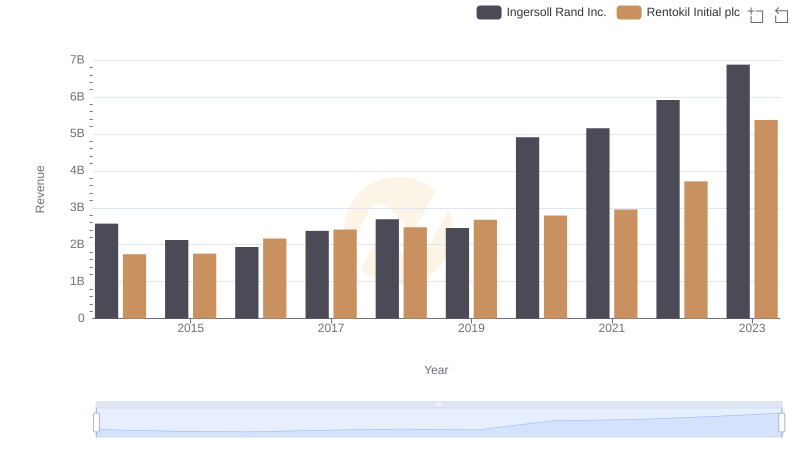
Comparing Revenue Performance: Ingersoll Rand Inc. or Rentokil Initial plc?
Cost Insights: Breaking Down Ingersoll Rand Inc. and C.H. Robinson Worldwide, Inc.'s Expenses
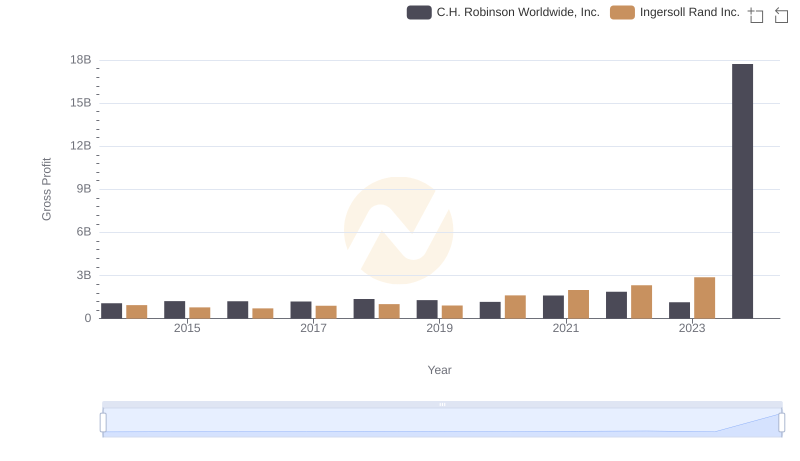
Ingersoll Rand Inc. and C.H. Robinson Worldwide, Inc.: A Detailed Gross Profit Analysis
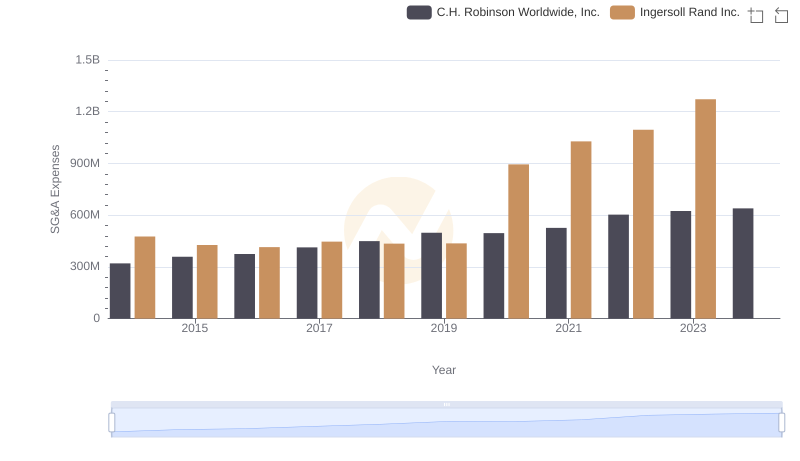
Breaking Down SG&A Expenses: Ingersoll Rand Inc. vs C.H. Robinson Worldwide, Inc.