| __timestamp | Cisco Systems, Inc. | PTC Inc. |
|---|---|---|
| Wednesday, January 1, 2014 | 11437000000 | 499679000 |
| Thursday, January 1, 2015 | 11861000000 | 557301000 |
| Friday, January 1, 2016 | 11433000000 | 513080000 |
| Sunday, January 1, 2017 | 11177000000 | 518013000 |
| Monday, January 1, 2018 | 11386000000 | 557505000 |
| Tuesday, January 1, 2019 | 11398000000 | 545368000 |
| Wednesday, January 1, 2020 | 11094000000 | 595277000 |
| Friday, January 1, 2021 | 11411000000 | 723785000 |
| Saturday, January 1, 2022 | 11186000000 | 689979000 |
| Sunday, January 1, 2023 | 12358000000 | 763641000 |
| Monday, January 1, 2024 | 13177000000 | 791331000 |
Cracking the code
In the ever-evolving tech industry, understanding financial trends is crucial for investors and analysts alike. This analysis delves into the Selling, General, and Administrative (SG&A) expenses of two tech giants: Cisco Systems, Inc. and PTC Inc., from 2014 to 2024.
Cisco Systems, a leader in networking technology, has seen its SG&A expenses fluctuate over the years, peaking in 2024 with a 15% increase from 2023. This trend reflects Cisco's strategic investments in innovation and market expansion. Meanwhile, PTC Inc., known for its software solutions, has experienced a steady rise in SG&A expenses, culminating in a 58% increase over the decade. This growth underscores PTC's commitment to enhancing its market presence and product offerings.
These insights provide a window into the financial strategies of these companies, highlighting their focus on growth and adaptation in a competitive landscape.
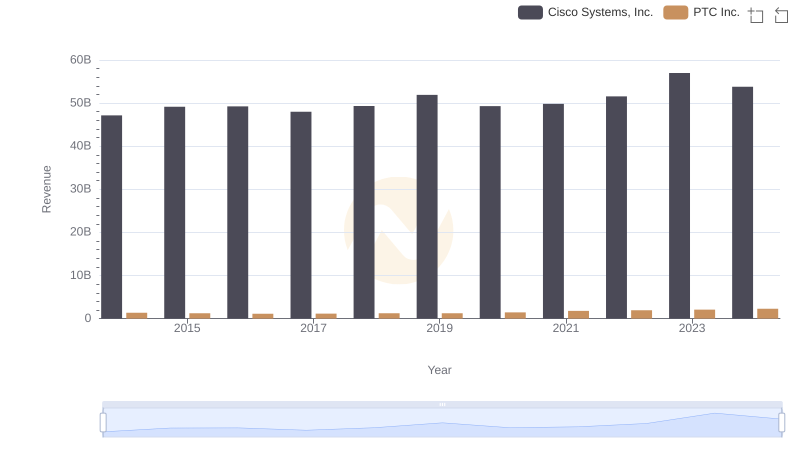
Cisco Systems, Inc. and PTC Inc.: A Comprehensive Revenue Analysis
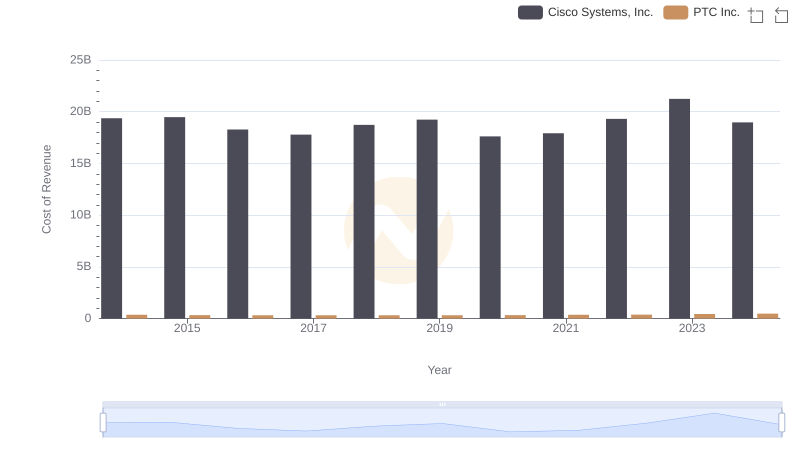
Cost Insights: Breaking Down Cisco Systems, Inc. and PTC Inc.'s Expenses
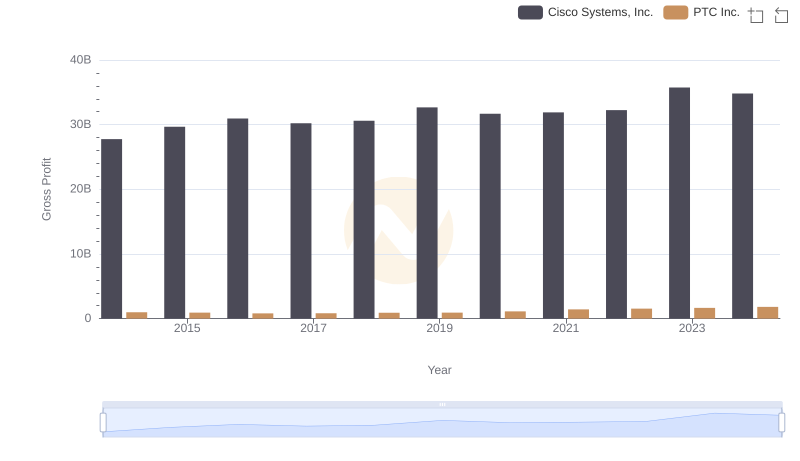
Who Generates Higher Gross Profit? Cisco Systems, Inc. or PTC Inc.
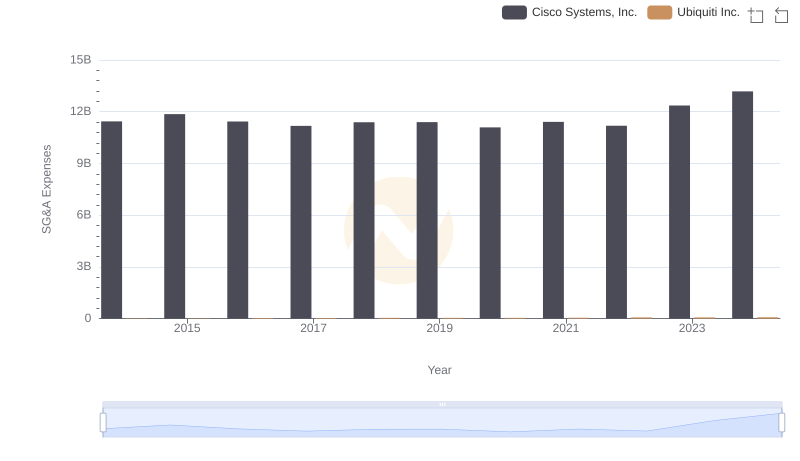
Cisco Systems, Inc. vs Ubiquiti Inc.: SG&A Expense Trends
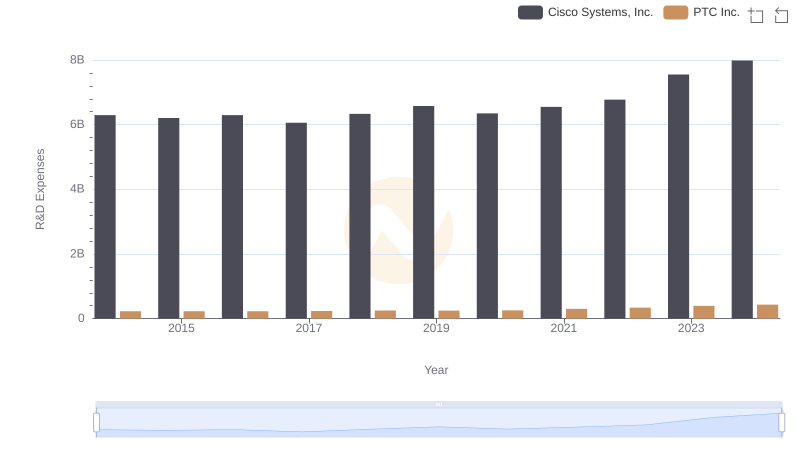
Research and Development Expenses Breakdown: Cisco Systems, Inc. vs PTC Inc.
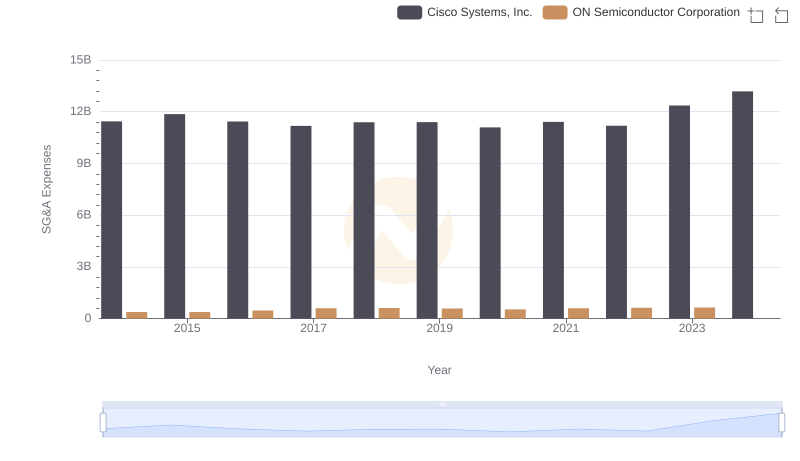
Selling, General, and Administrative Costs: Cisco Systems, Inc. vs ON Semiconductor Corporation

Cisco Systems, Inc. vs FLEETCOR Technologies, Inc.: SG&A Expense Trends
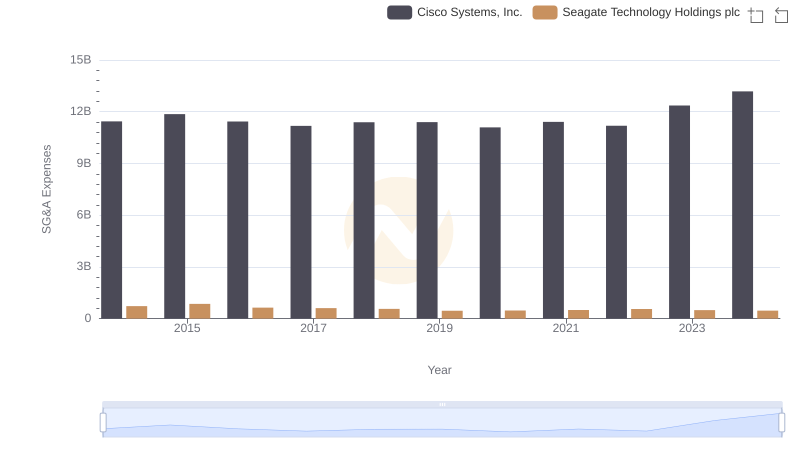
SG&A Efficiency Analysis: Comparing Cisco Systems, Inc. and Seagate Technology Holdings plc
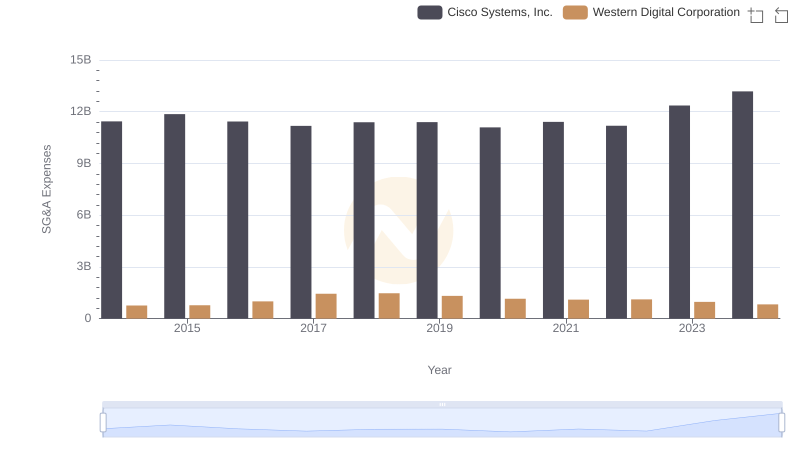
Breaking Down SG&A Expenses: Cisco Systems, Inc. vs Western Digital Corporation
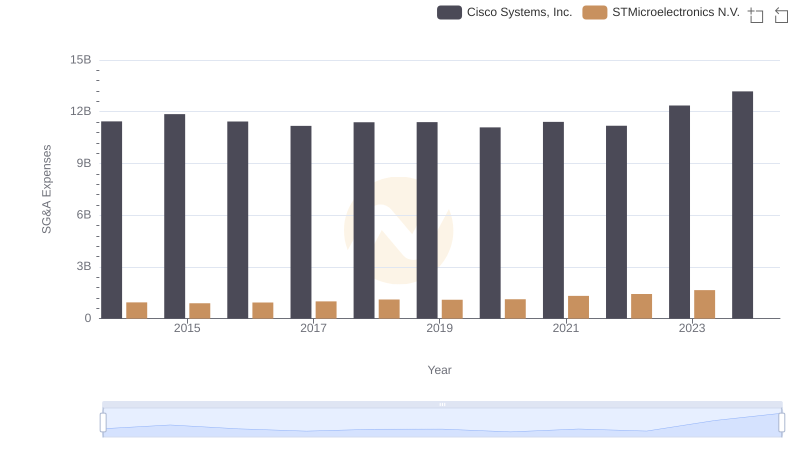
Operational Costs Compared: SG&A Analysis of Cisco Systems, Inc. and STMicroelectronics N.V.
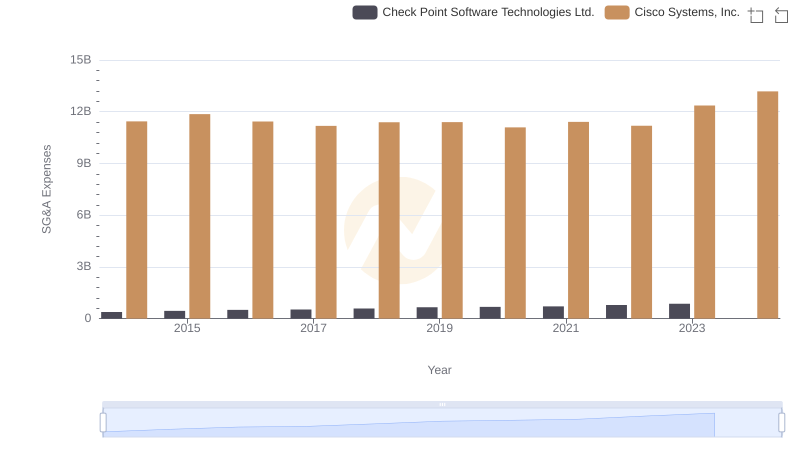
Cisco Systems, Inc. vs Check Point Software Technologies Ltd.: SG&A Expense Trends
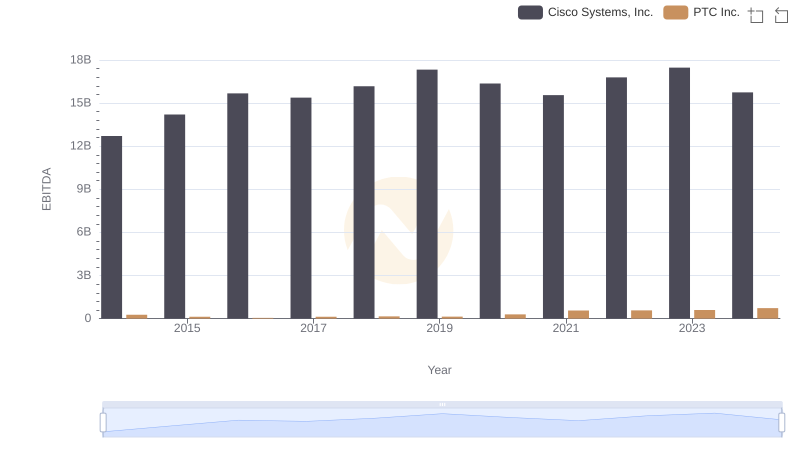
A Professional Review of EBITDA: Cisco Systems, Inc. Compared to PTC Inc.