| __timestamp | Cisco Systems, Inc. | Seagate Technology Holdings plc |
|---|---|---|
| Wednesday, January 1, 2014 | 19373000000 | 9878000000 |
| Thursday, January 1, 2015 | 19480000000 | 9930000000 |
| Friday, January 1, 2016 | 18287000000 | 8545000000 |
| Sunday, January 1, 2017 | 17781000000 | 7597000000 |
| Monday, January 1, 2018 | 18724000000 | 7820000000 |
| Tuesday, January 1, 2019 | 19238000000 | 7458000000 |
| Wednesday, January 1, 2020 | 17618000000 | 7667000000 |
| Friday, January 1, 2021 | 17924000000 | 7764000000 |
| Saturday, January 1, 2022 | 19309000000 | 8192000000 |
| Sunday, January 1, 2023 | 21245000000 | 6033000000 |
| Monday, January 1, 2024 | 18975000000 | 5005000000 |
Igniting the spark of knowledge
In the ever-evolving tech industry, understanding cost structures is crucial for investors and analysts. This analysis delves into the cost of revenue trends for Cisco Systems, Inc. and Seagate Technology Holdings plc from 2014 to 2024. Over this decade, Cisco's cost of revenue fluctuated, peaking in 2023 with a 10% increase from its 2014 value. In contrast, Seagate's cost of revenue saw a significant decline, dropping by nearly 50% from 2014 to 2024. This divergence highlights Cisco's robust growth strategy, while Seagate appears to be optimizing its cost structure. The data suggests that Cisco is investing heavily in its operations, potentially to capture more market share, whereas Seagate is focusing on efficiency. These insights provide a window into the strategic priorities of these tech giants, offering valuable information for stakeholders.
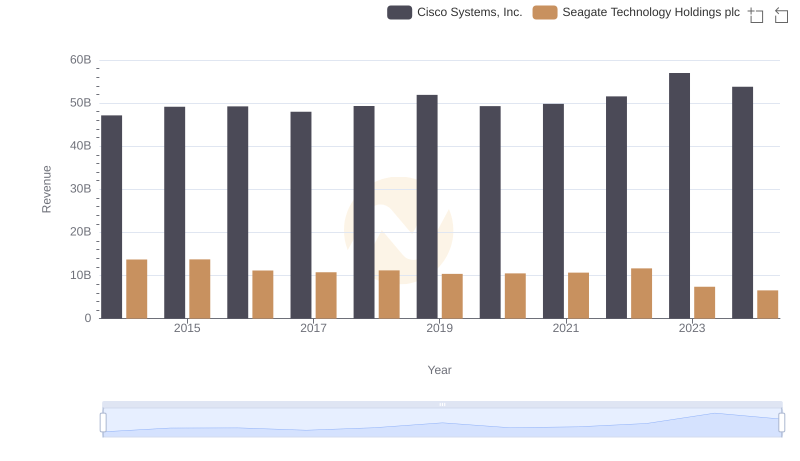
Cisco Systems, Inc. vs Seagate Technology Holdings plc: Examining Key Revenue Metrics
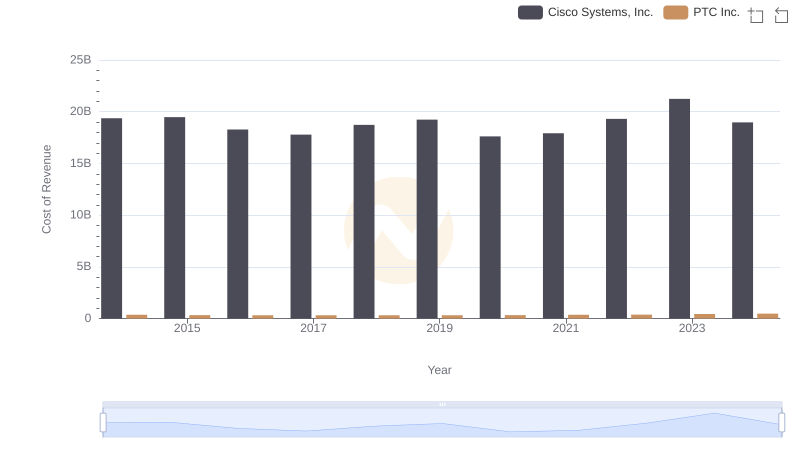
Cost Insights: Breaking Down Cisco Systems, Inc. and PTC Inc.'s Expenses
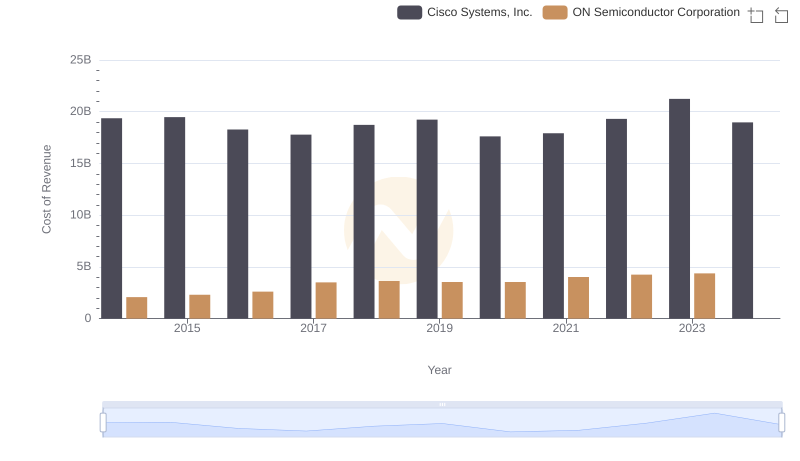
Cost of Revenue Trends: Cisco Systems, Inc. vs ON Semiconductor Corporation
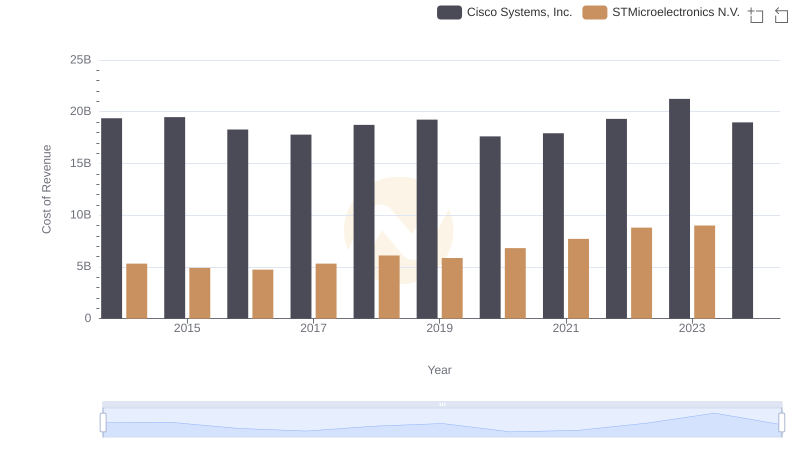
Cisco Systems, Inc. vs STMicroelectronics N.V.: Efficiency in Cost of Revenue Explored
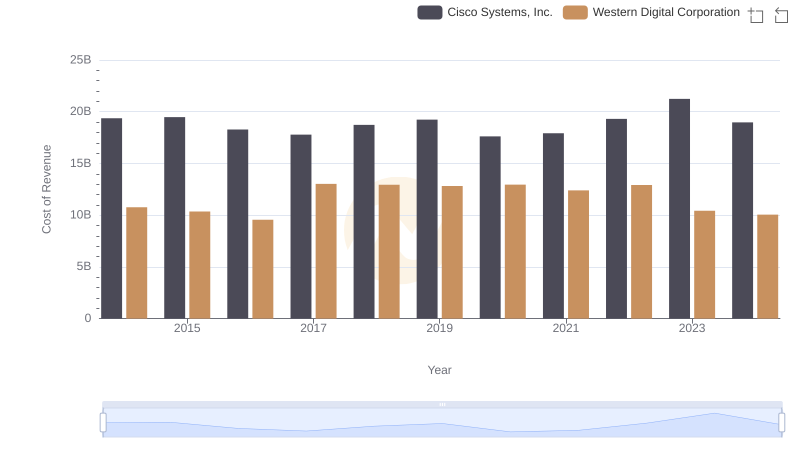
Cost of Revenue: Key Insights for Cisco Systems, Inc. and Western Digital Corporation
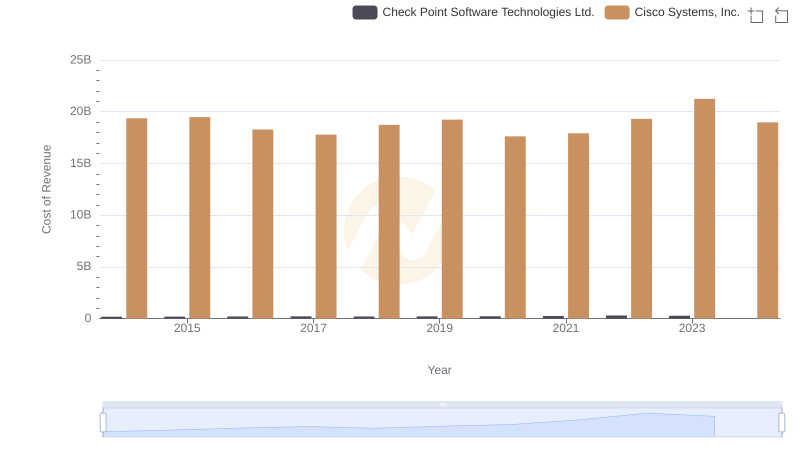
Cisco Systems, Inc. vs Check Point Software Technologies Ltd.: Efficiency in Cost of Revenue Explored
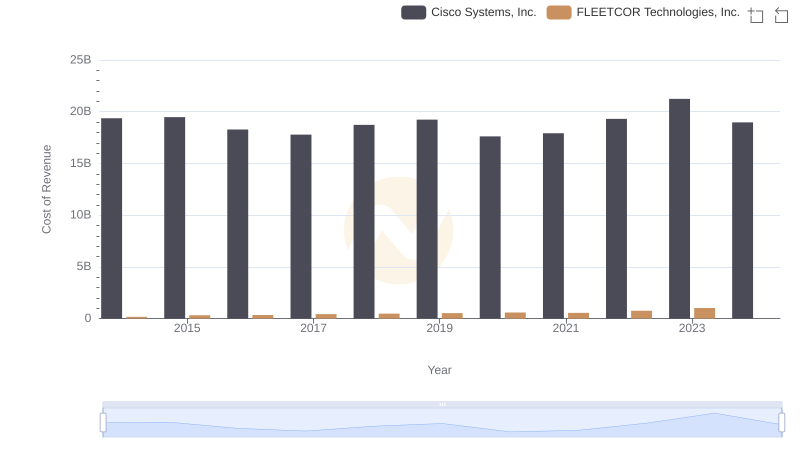
Cost Insights: Breaking Down Cisco Systems, Inc. and FLEETCOR Technologies, Inc.'s Expenses
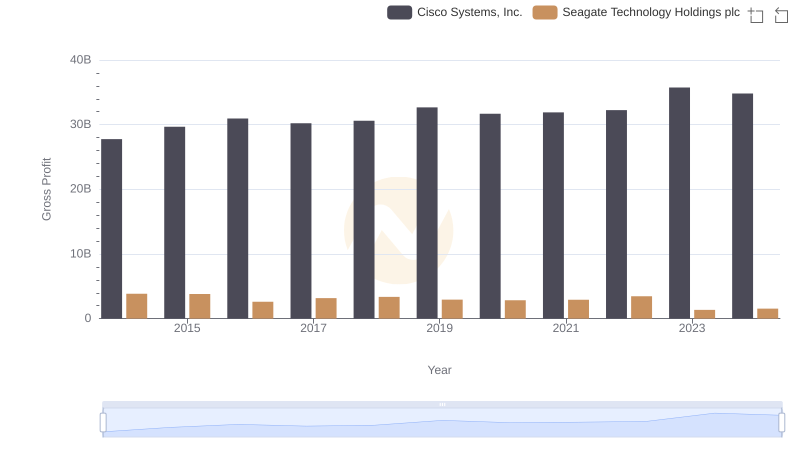
Who Generates Higher Gross Profit? Cisco Systems, Inc. or Seagate Technology Holdings plc
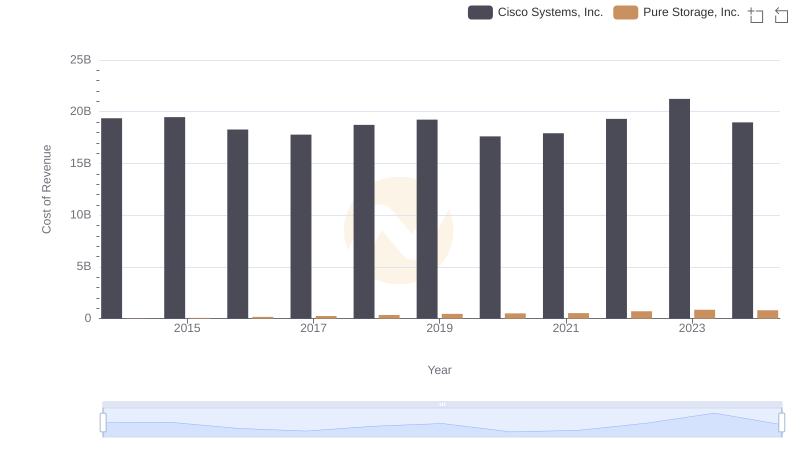
Cost of Revenue: Key Insights for Cisco Systems, Inc. and Pure Storage, Inc.
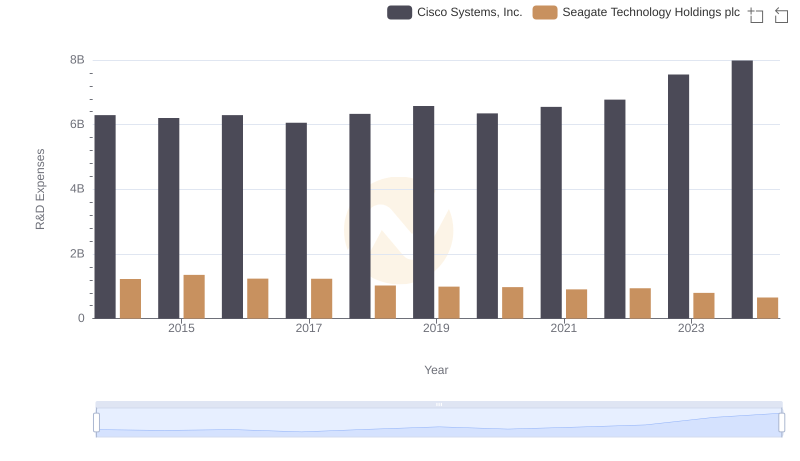
Who Prioritizes Innovation? R&D Spending Compared for Cisco Systems, Inc. and Seagate Technology Holdings plc
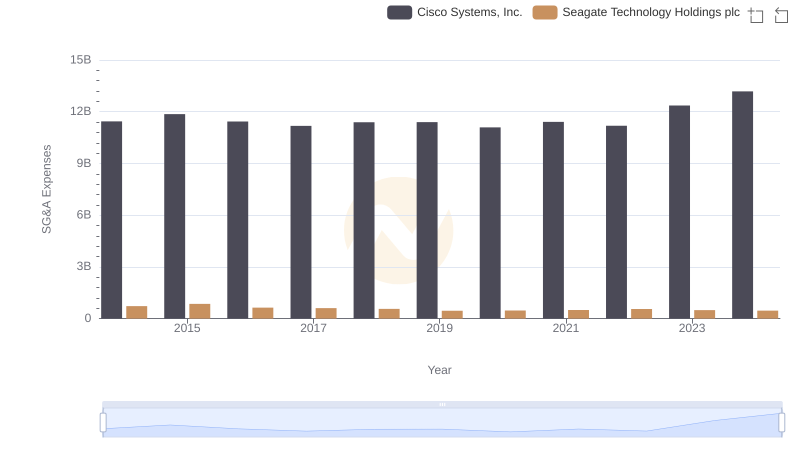
SG&A Efficiency Analysis: Comparing Cisco Systems, Inc. and Seagate Technology Holdings plc
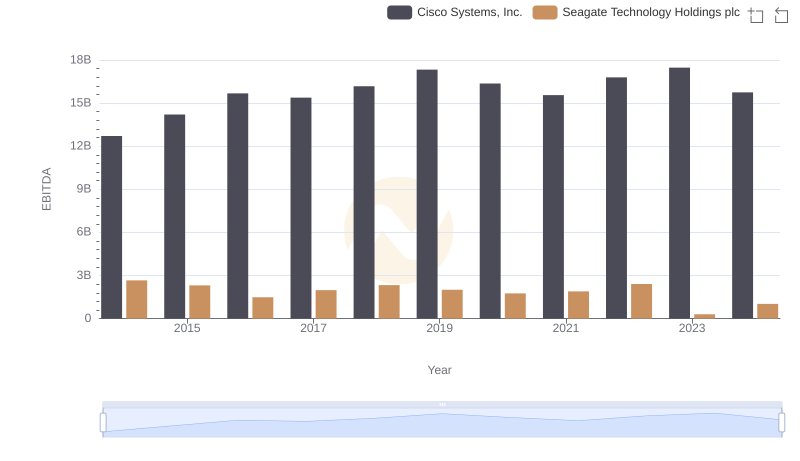
Cisco Systems, Inc. and Seagate Technology Holdings plc: A Detailed Examination of EBITDA Performance