| __timestamp | Check Point Software Technologies Ltd. | Cisco Systems, Inc. |
|---|---|---|
| Wednesday, January 1, 2014 | 176541000 | 19373000000 |
| Thursday, January 1, 2015 | 189057000 | 19480000000 |
| Friday, January 1, 2016 | 202003000 | 18287000000 |
| Sunday, January 1, 2017 | 212963000 | 17781000000 |
| Monday, January 1, 2018 | 201379000 | 18724000000 |
| Tuesday, January 1, 2019 | 215400000 | 19238000000 |
| Wednesday, January 1, 2020 | 226500000 | 17618000000 |
| Friday, January 1, 2021 | 258100000 | 17924000000 |
| Saturday, January 1, 2022 | 304400000 | 19309000000 |
| Sunday, January 1, 2023 | 282600000 | 21245000000 |
| Monday, January 1, 2024 | 18975000000 |
Unlocking the unknown
In the ever-evolving tech landscape, cost efficiency remains a pivotal factor for success. This analysis delves into the cost of revenue trends for Cisco Systems, Inc. and Check Point Software Technologies Ltd. from 2014 to 2023. Cisco, a global leader in networking, consistently reported a cost of revenue averaging around $18.9 billion annually. In contrast, Check Point, a cybersecurity powerhouse, maintained a significantly lower average of approximately $227 million, highlighting a stark difference in scale and operational strategy.
This data underscores the diverse approaches these tech giants take in managing their operational costs, reflecting their unique market positions and strategic priorities.
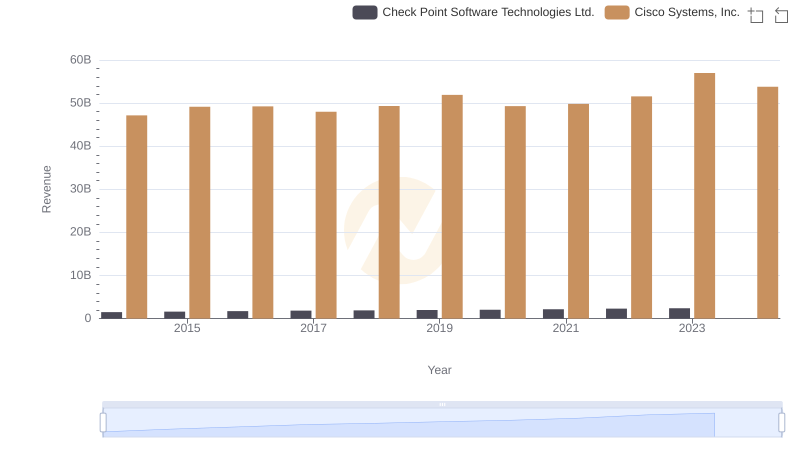
Annual Revenue Comparison: Cisco Systems, Inc. vs Check Point Software Technologies Ltd.
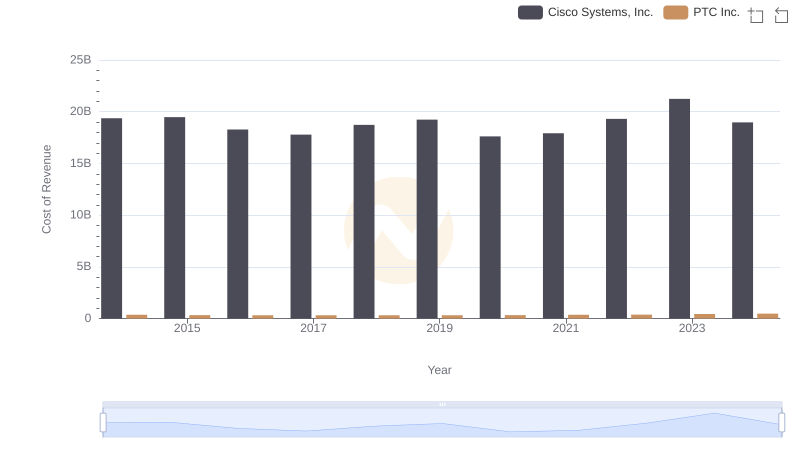
Cost Insights: Breaking Down Cisco Systems, Inc. and PTC Inc.'s Expenses
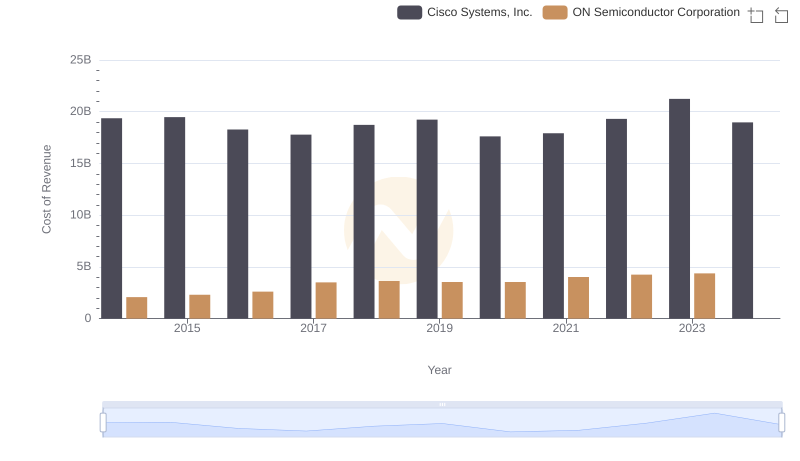
Cost of Revenue Trends: Cisco Systems, Inc. vs ON Semiconductor Corporation
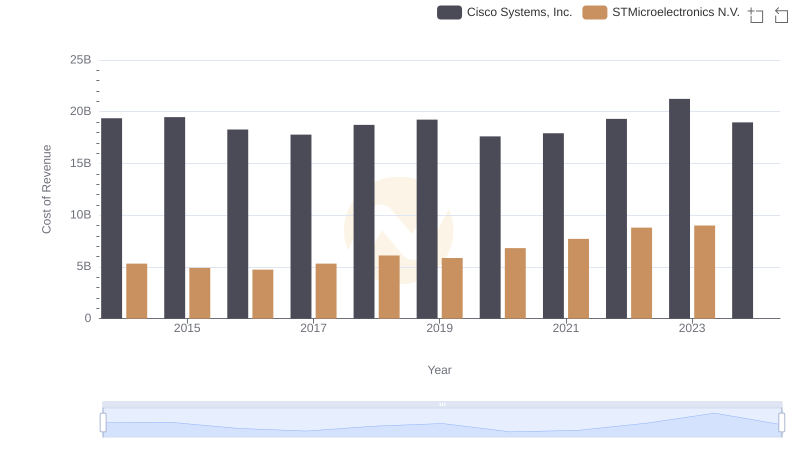
Cisco Systems, Inc. vs STMicroelectronics N.V.: Efficiency in Cost of Revenue Explored
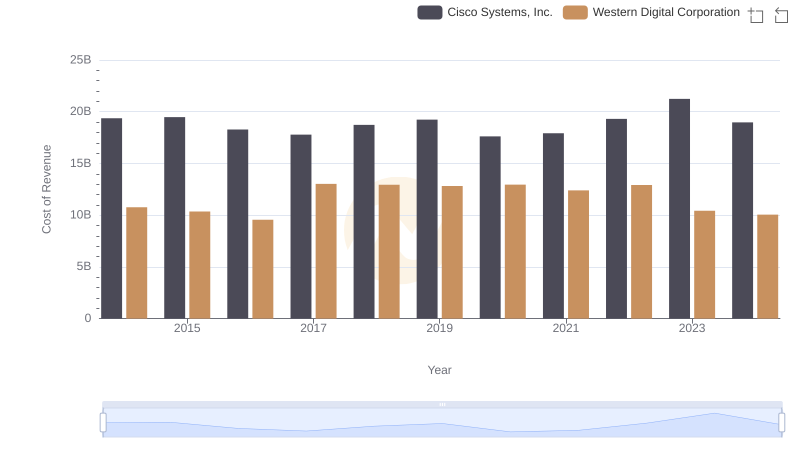
Cost of Revenue: Key Insights for Cisco Systems, Inc. and Western Digital Corporation
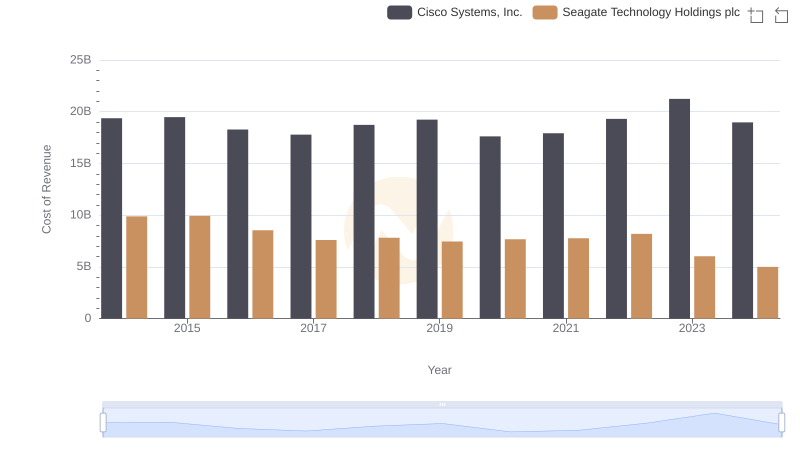
Analyzing Cost of Revenue: Cisco Systems, Inc. and Seagate Technology Holdings plc
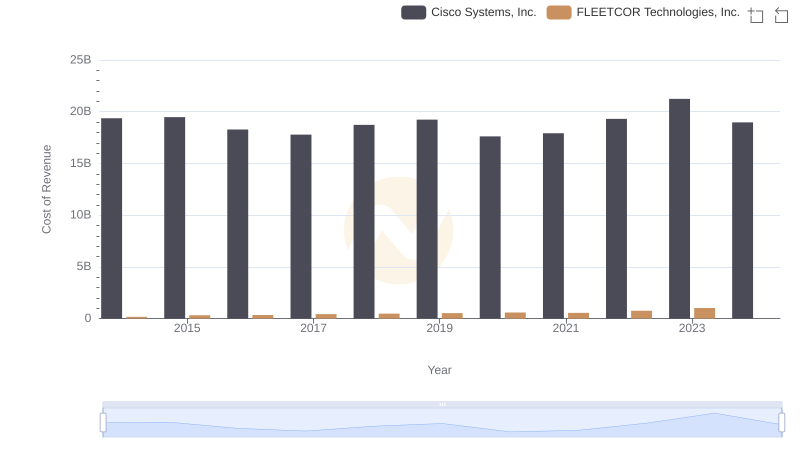
Cost Insights: Breaking Down Cisco Systems, Inc. and FLEETCOR Technologies, Inc.'s Expenses
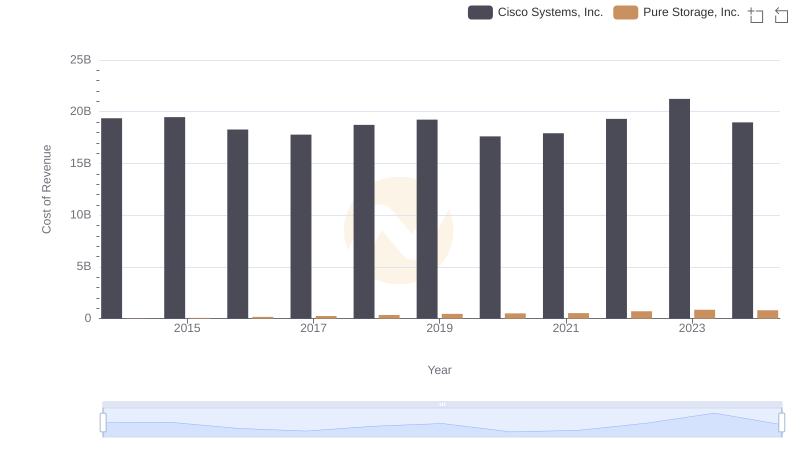
Cost of Revenue: Key Insights for Cisco Systems, Inc. and Pure Storage, Inc.
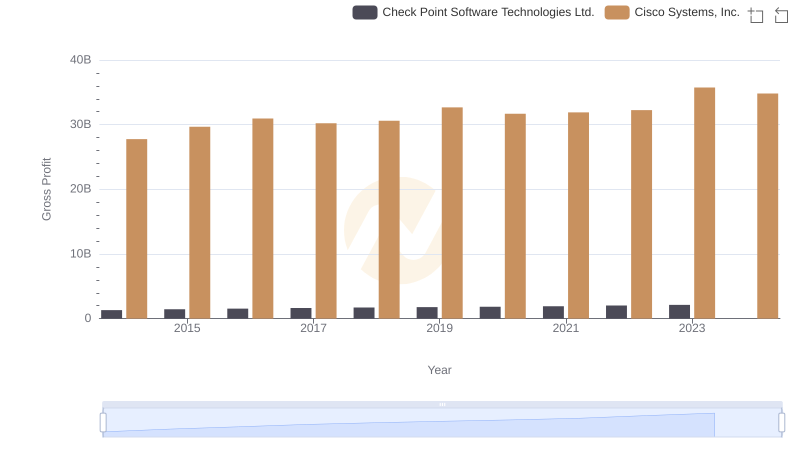
Key Insights on Gross Profit: Cisco Systems, Inc. vs Check Point Software Technologies Ltd.
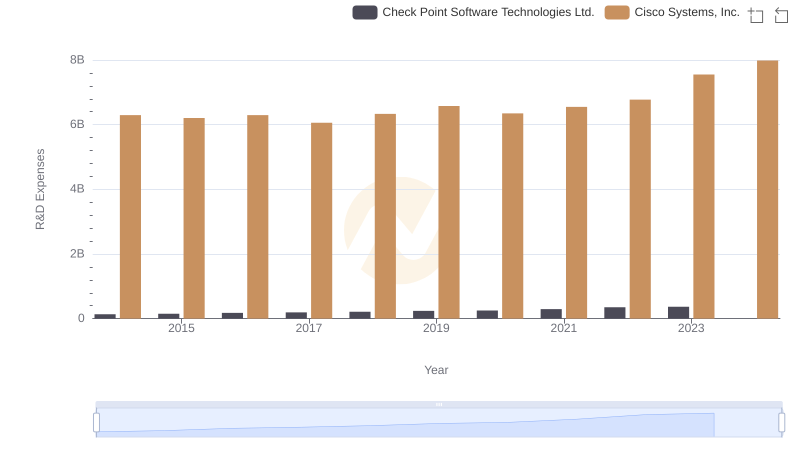
Cisco Systems, Inc. vs Check Point Software Technologies Ltd.: Strategic Focus on R&D Spending
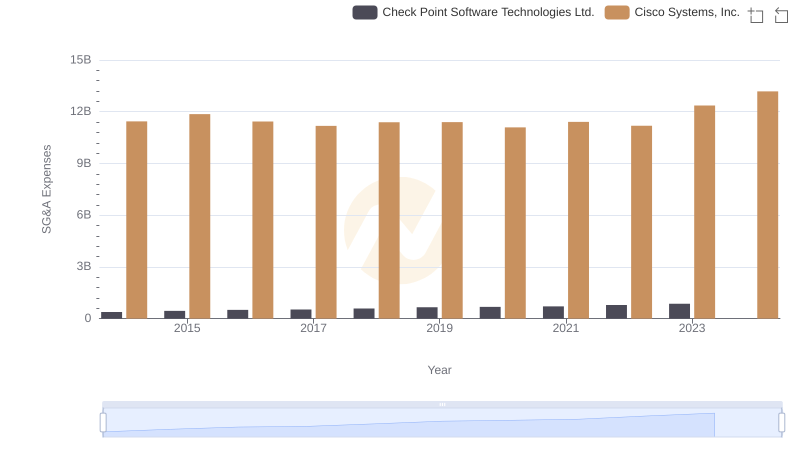
Cisco Systems, Inc. vs Check Point Software Technologies Ltd.: SG&A Expense Trends
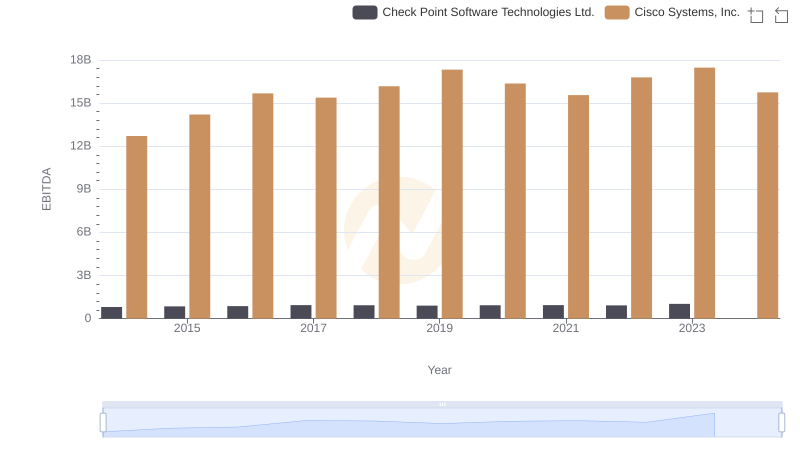
Comparative EBITDA Analysis: Cisco Systems, Inc. vs Check Point Software Technologies Ltd.