| __timestamp | Cisco Systems, Inc. | PTC Inc. |
|---|---|---|
| Wednesday, January 1, 2014 | 12709000000 | 271574000 |
| Thursday, January 1, 2015 | 14209000000 | 125699999 |
| Friday, January 1, 2016 | 15678000000 | 49244000 |
| Sunday, January 1, 2017 | 15383000000 | 127736000 |
| Monday, January 1, 2018 | 16172000000 | 157737000 |
| Tuesday, January 1, 2019 | 17334000000 | 141171000 |
| Wednesday, January 1, 2020 | 16363000000 | 291951000 |
| Friday, January 1, 2021 | 15558000000 | 564767000 |
| Saturday, January 1, 2022 | 16794000000 | 573406000 |
| Sunday, January 1, 2023 | 17471000000 | 599145000 |
| Monday, January 1, 2024 | 15747000000 | 730022000 |
Unleashing the power of data
In the ever-evolving landscape of technology, Cisco Systems, Inc. and PTC Inc. have showcased remarkable financial trajectories over the past decade. From 2014 to 2024, Cisco's EBITDA has consistently outperformed PTC's, highlighting its robust market position. Cisco's EBITDA grew by approximately 38% from 2014 to 2023, peaking in 2023 with a notable 17.5 billion USD. In contrast, PTC Inc. demonstrated a more volatile journey, with its EBITDA increasing by over 1600% during the same period, reaching its highest in 2024. This stark contrast underscores Cisco's steady growth and PTC's dynamic expansion strategy. As we look to the future, these trends offer valuable insights into the strategic maneuvers of these tech giants, providing a window into their financial health and market strategies.
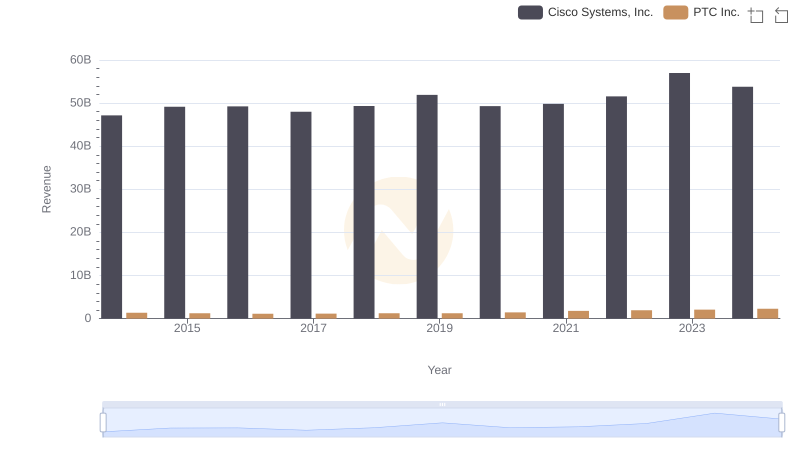
Cisco Systems, Inc. and PTC Inc.: A Comprehensive Revenue Analysis
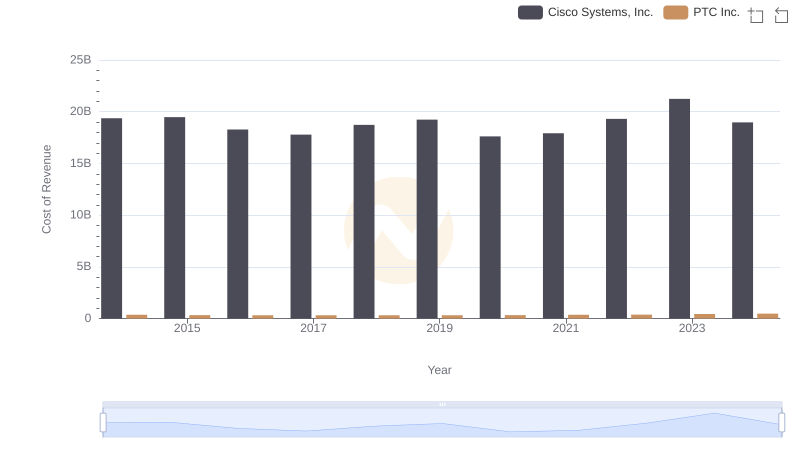
Cost Insights: Breaking Down Cisco Systems, Inc. and PTC Inc.'s Expenses
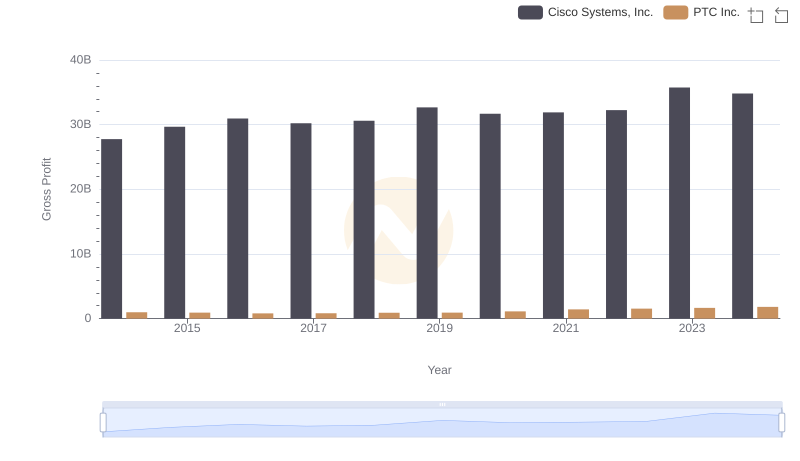
Who Generates Higher Gross Profit? Cisco Systems, Inc. or PTC Inc.
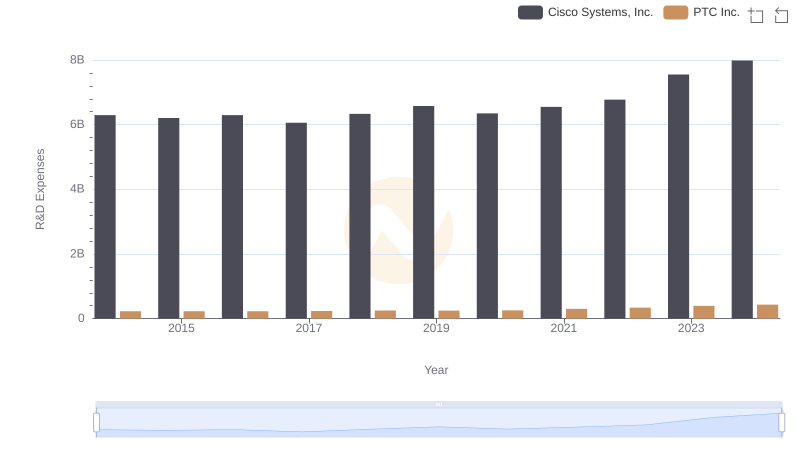
Research and Development Expenses Breakdown: Cisco Systems, Inc. vs PTC Inc.
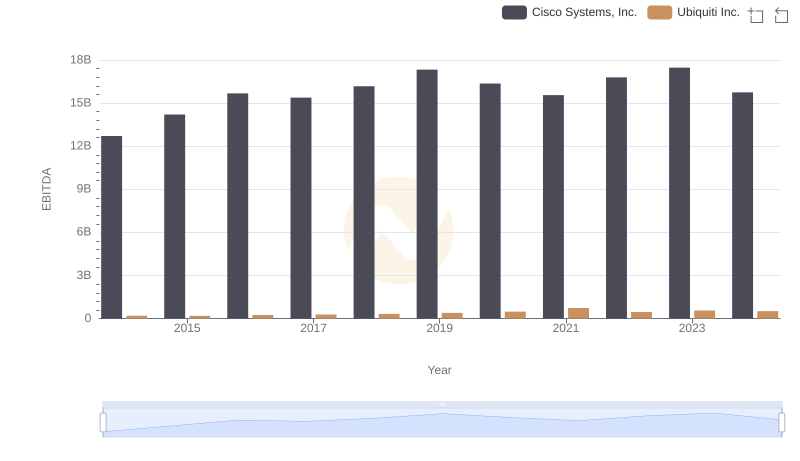
Comprehensive EBITDA Comparison: Cisco Systems, Inc. vs Ubiquiti Inc.
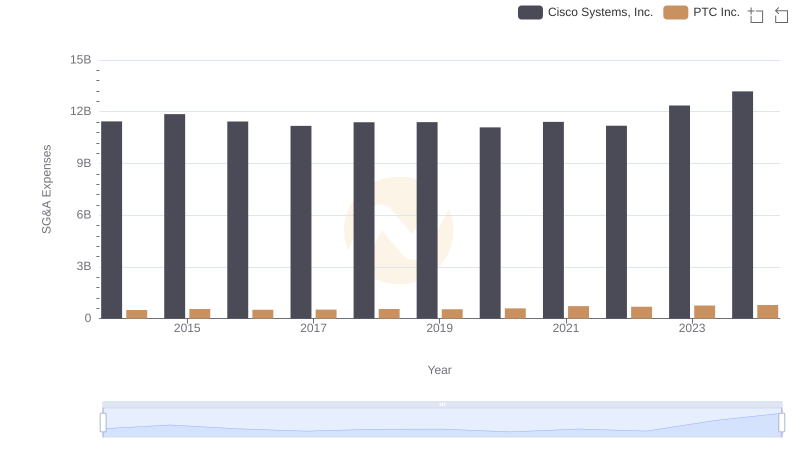
Cisco Systems, Inc. vs PTC Inc.: SG&A Expense Trends

Professional EBITDA Benchmarking: Cisco Systems, Inc. vs ON Semiconductor Corporation
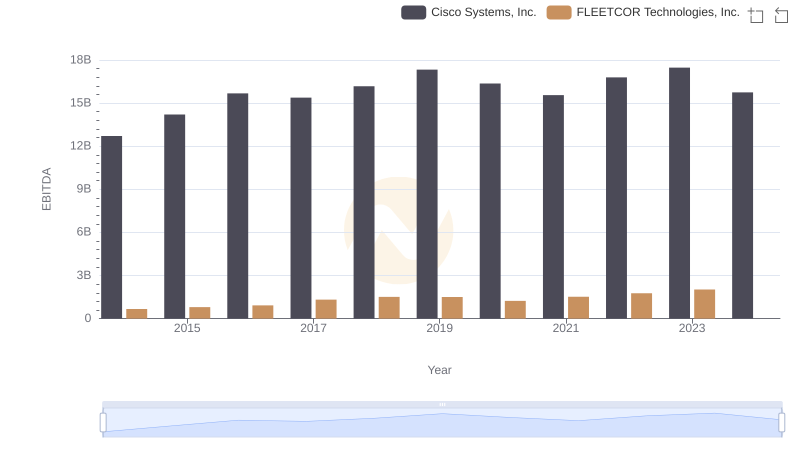
EBITDA Metrics Evaluated: Cisco Systems, Inc. vs FLEETCOR Technologies, Inc.
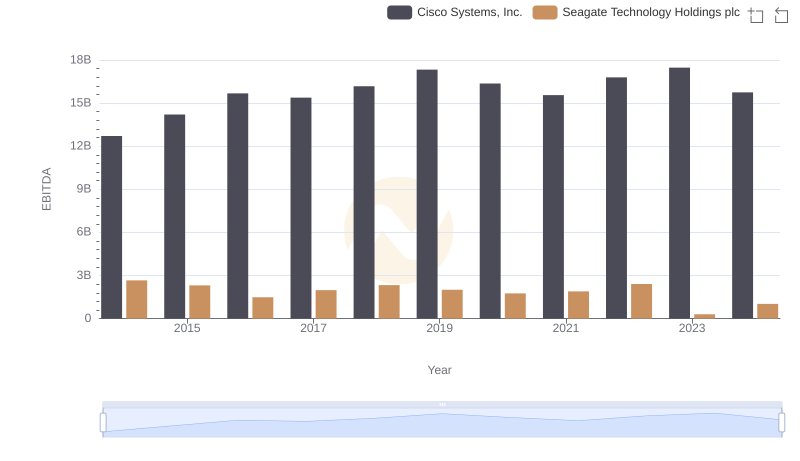
Cisco Systems, Inc. and Seagate Technology Holdings plc: A Detailed Examination of EBITDA Performance
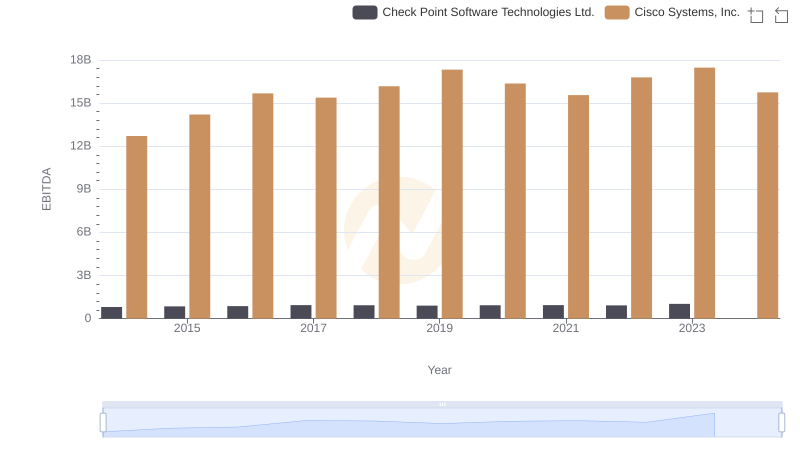
Comparative EBITDA Analysis: Cisco Systems, Inc. vs Check Point Software Technologies Ltd.
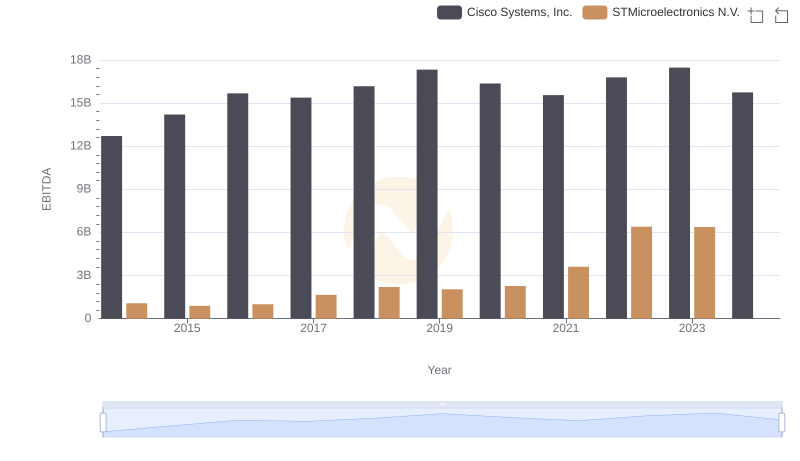
EBITDA Analysis: Evaluating Cisco Systems, Inc. Against STMicroelectronics N.V.
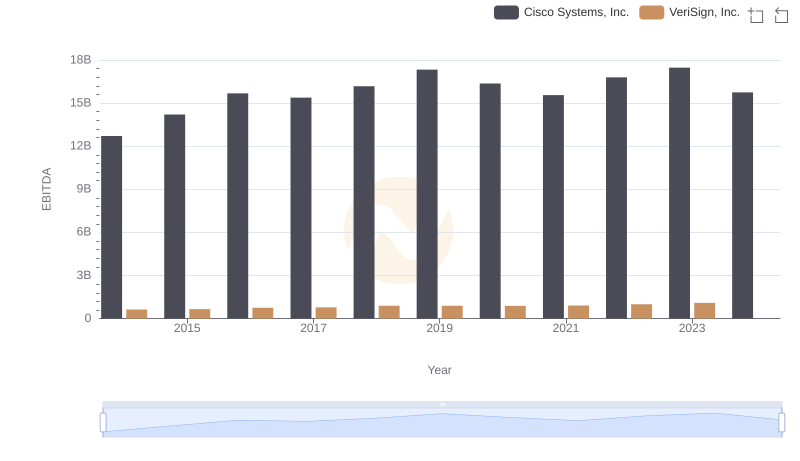
EBITDA Metrics Evaluated: Cisco Systems, Inc. vs VeriSign, Inc.