| __timestamp | Cisco Systems, Inc. | FLEETCOR Technologies, Inc. |
|---|---|---|
| Wednesday, January 1, 2014 | 19373000000 | 173337000 |
| Thursday, January 1, 2015 | 19480000000 | 331073000 |
| Friday, January 1, 2016 | 18287000000 | 355414000 |
| Sunday, January 1, 2017 | 17781000000 | 429613000 |
| Monday, January 1, 2018 | 18724000000 | 487695000 |
| Tuesday, January 1, 2019 | 19238000000 | 530669000 |
| Wednesday, January 1, 2020 | 17618000000 | 596363000 |
| Friday, January 1, 2021 | 17924000000 | 559819000 |
| Saturday, January 1, 2022 | 19309000000 | 764707000 |
| Sunday, January 1, 2023 | 21245000000 | 1030138999 |
| Monday, January 1, 2024 | 18975000000 | 0 |
Unleashing the power of data
In the ever-evolving landscape of technology and financial services, understanding cost structures is crucial. Cisco Systems, Inc., a leader in networking hardware, and FLEETCOR Technologies, Inc., a prominent player in payment solutions, offer intriguing insights into their cost dynamics over the past decade.
From 2014 to 2023, Cisco's cost of revenue fluctuated, peaking in 2023 with a 10% increase from 2022. This reflects Cisco's strategic investments in innovation and infrastructure. In contrast, FLEETCOR's cost of revenue surged by nearly 500% from 2014 to 2023, highlighting its aggressive expansion and adaptation to digital payment trends.
Interestingly, 2024 data for FLEETCOR is missing, suggesting a potential shift or anomaly in reporting. This absence invites speculation about future strategies. As these giants navigate their respective industries, their cost trends offer a window into their operational priorities and market responses.
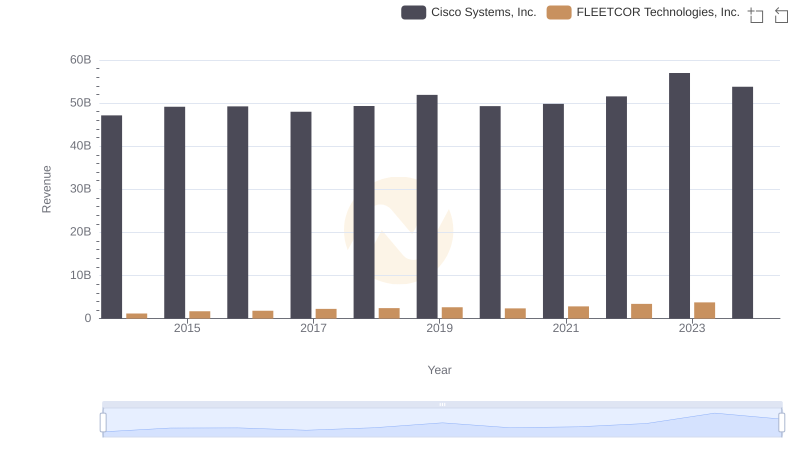
Revenue Insights: Cisco Systems, Inc. and FLEETCOR Technologies, Inc. Performance Compared
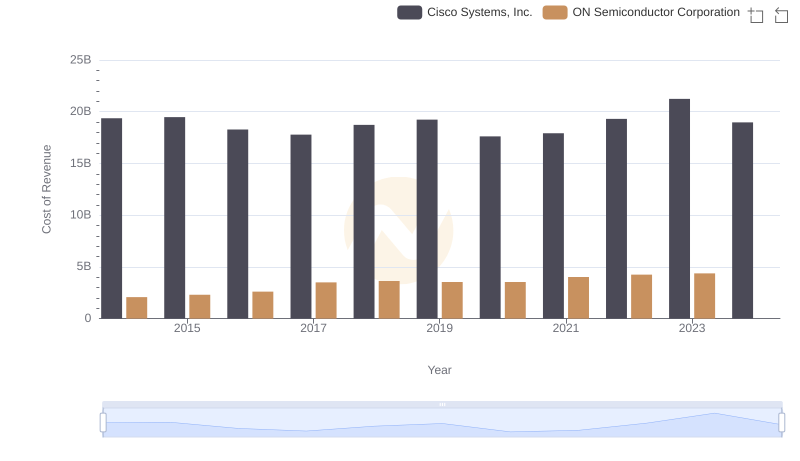
Cost of Revenue Trends: Cisco Systems, Inc. vs ON Semiconductor Corporation
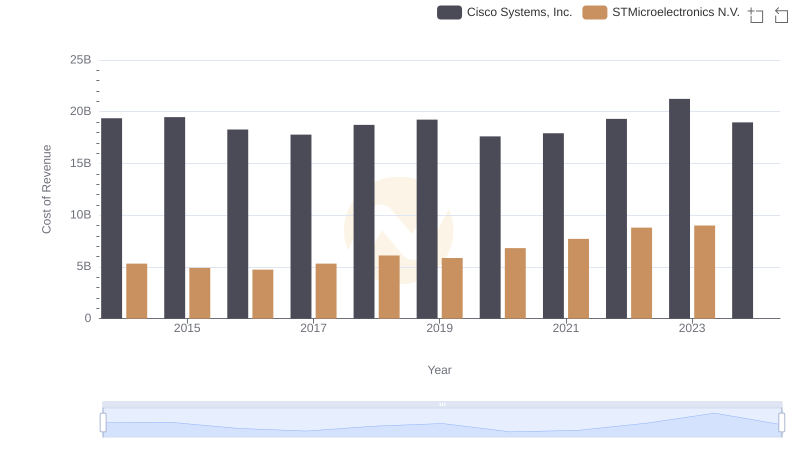
Cisco Systems, Inc. vs STMicroelectronics N.V.: Efficiency in Cost of Revenue Explored
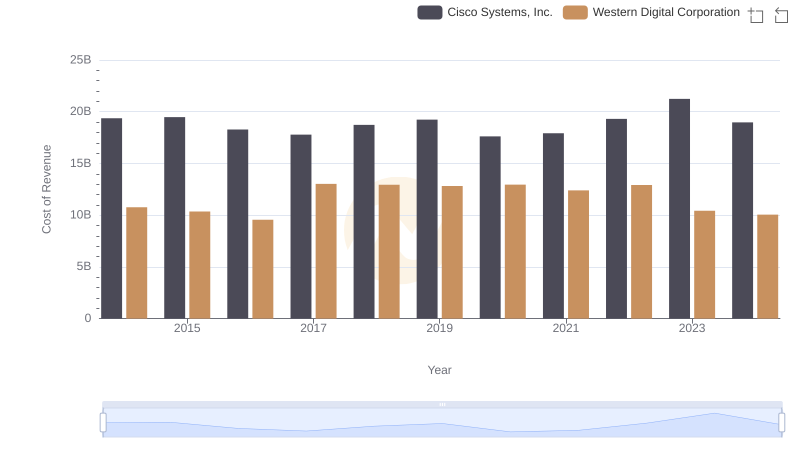
Cost of Revenue: Key Insights for Cisco Systems, Inc. and Western Digital Corporation
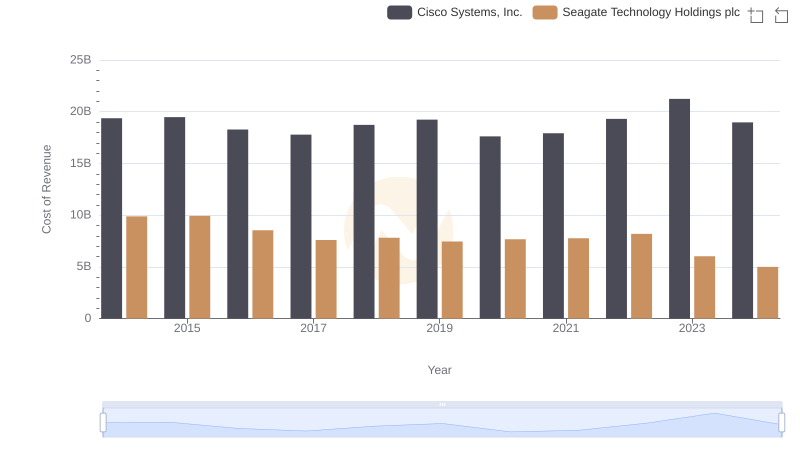
Analyzing Cost of Revenue: Cisco Systems, Inc. and Seagate Technology Holdings plc
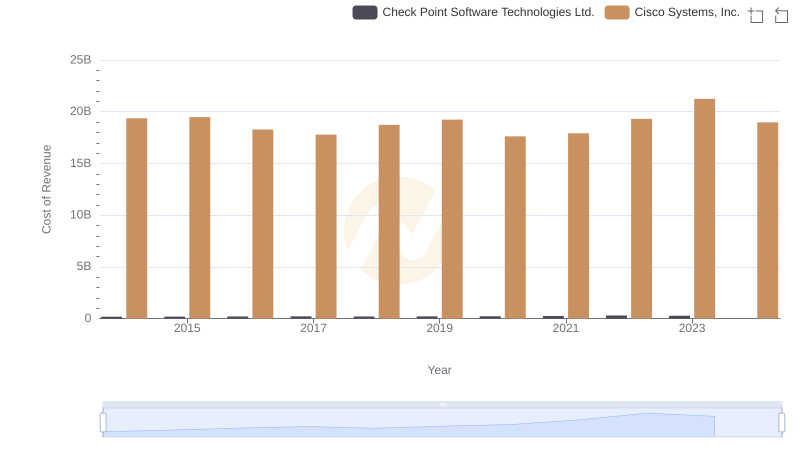
Cisco Systems, Inc. vs Check Point Software Technologies Ltd.: Efficiency in Cost of Revenue Explored
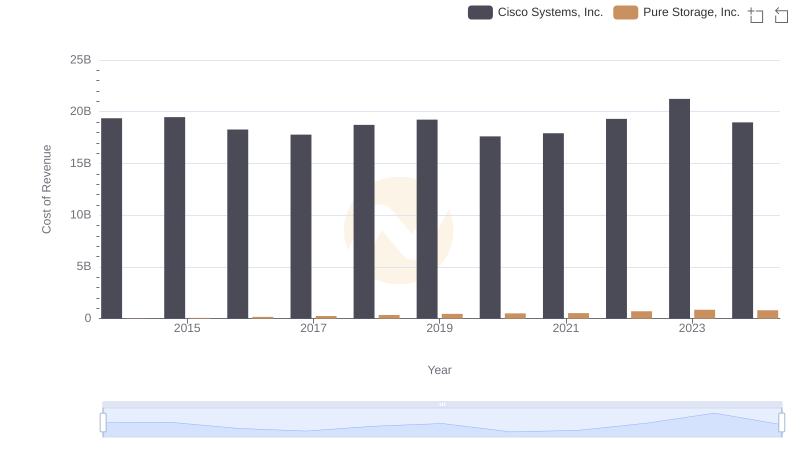
Cost of Revenue: Key Insights for Cisco Systems, Inc. and Pure Storage, Inc.
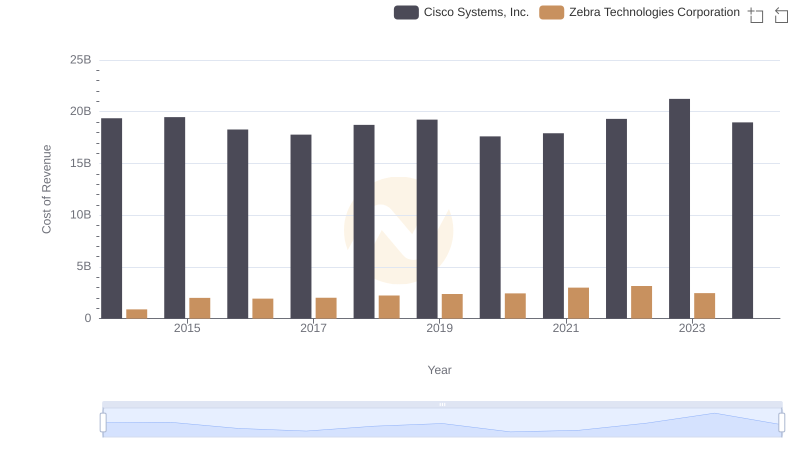
Cost Insights: Breaking Down Cisco Systems, Inc. and Zebra Technologies Corporation's Expenses
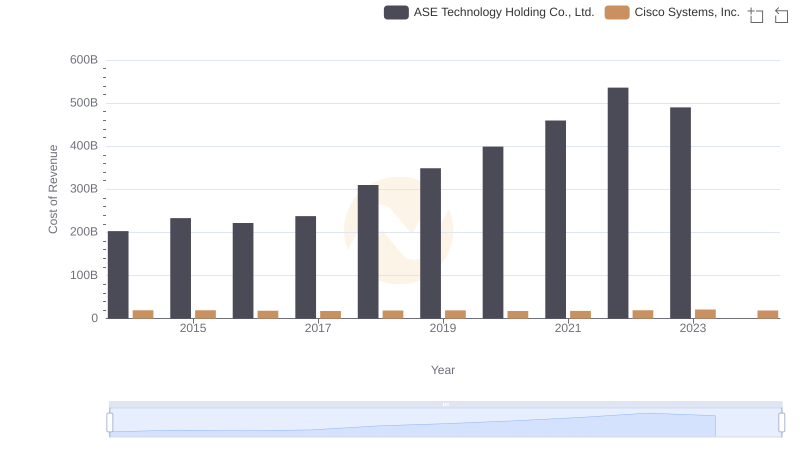
Analyzing Cost of Revenue: Cisco Systems, Inc. and ASE Technology Holding Co., Ltd.
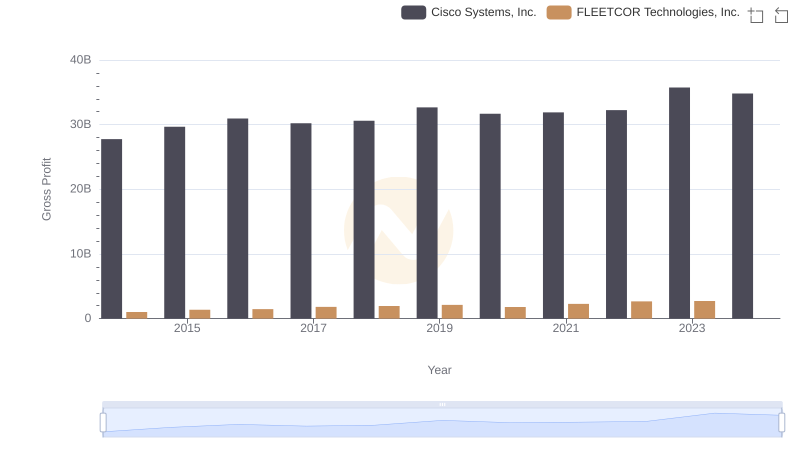
Gross Profit Analysis: Comparing Cisco Systems, Inc. and FLEETCOR Technologies, Inc.
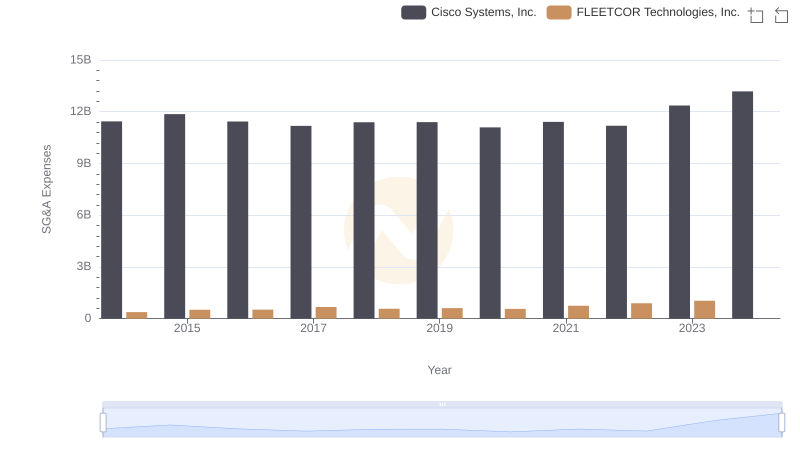
Cisco Systems, Inc. vs FLEETCOR Technologies, Inc.: SG&A Expense Trends
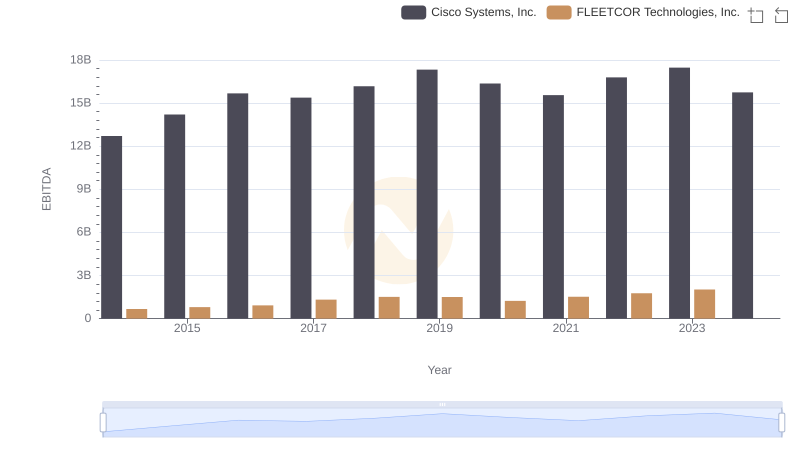
EBITDA Metrics Evaluated: Cisco Systems, Inc. vs FLEETCOR Technologies, Inc.