| __timestamp | Cisco Systems, Inc. | Western Digital Corporation |
|---|---|---|
| Wednesday, January 1, 2014 | 19373000000 | 10770000000 |
| Thursday, January 1, 2015 | 19480000000 | 10351000000 |
| Friday, January 1, 2016 | 18287000000 | 9559000000 |
| Sunday, January 1, 2017 | 17781000000 | 13021000000 |
| Monday, January 1, 2018 | 18724000000 | 12942000000 |
| Tuesday, January 1, 2019 | 19238000000 | 12817000000 |
| Wednesday, January 1, 2020 | 17618000000 | 12955000000 |
| Friday, January 1, 2021 | 17924000000 | 12401000000 |
| Saturday, January 1, 2022 | 19309000000 | 12919000000 |
| Sunday, January 1, 2023 | 21245000000 | 10431000000 |
| Monday, January 1, 2024 | 18975000000 | 10058000000 |
In pursuit of knowledge
In the ever-evolving tech industry, understanding cost structures is crucial. Cisco Systems, Inc. and Western Digital Corporation, two giants in the field, have shown intriguing trends in their cost of revenue from 2014 to 2024. Cisco's cost of revenue peaked in 2023, reaching approximately 12% higher than its 2014 value, indicating strategic investments or increased production costs. Meanwhile, Western Digital's cost of revenue saw a more volatile journey, with a notable dip in 2016, followed by a peak in 2017, and a gradual decline thereafter. This fluctuation could reflect shifts in market demand or operational adjustments. By 2024, both companies show a downward trend, suggesting potential efficiency improvements or market changes. These insights provide a window into the financial strategies and market responses of these tech leaders over the past decade.
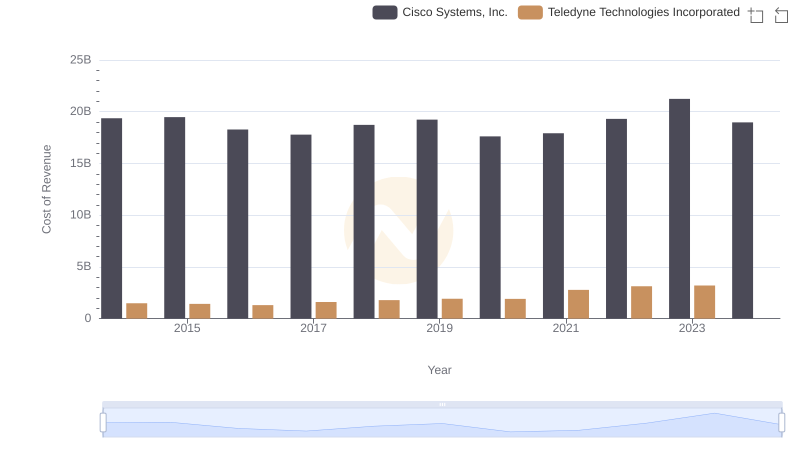
Cost of Revenue Comparison: Cisco Systems, Inc. vs Teledyne Technologies Incorporated
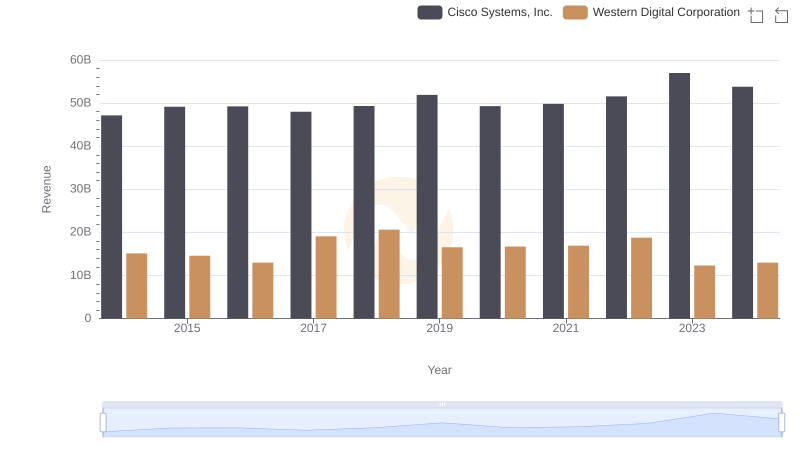
Who Generates More Revenue? Cisco Systems, Inc. or Western Digital Corporation
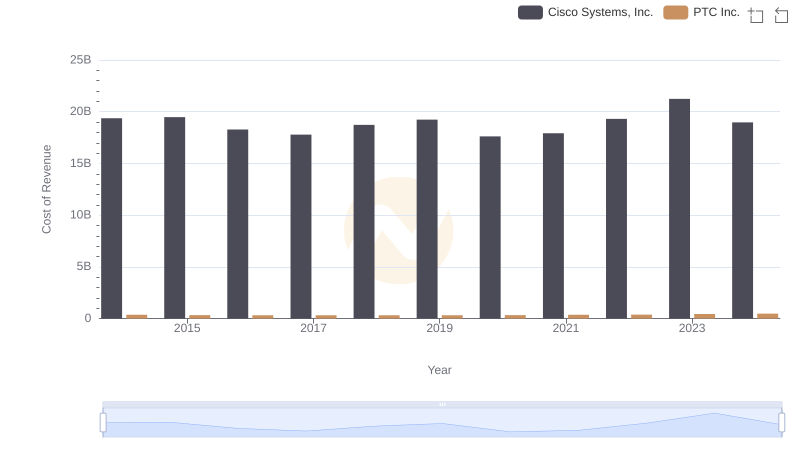
Cost Insights: Breaking Down Cisco Systems, Inc. and PTC Inc.'s Expenses
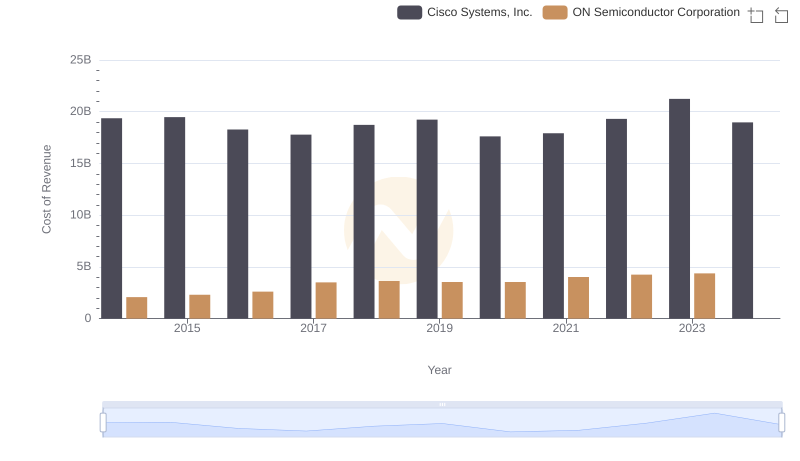
Cost of Revenue Trends: Cisco Systems, Inc. vs ON Semiconductor Corporation
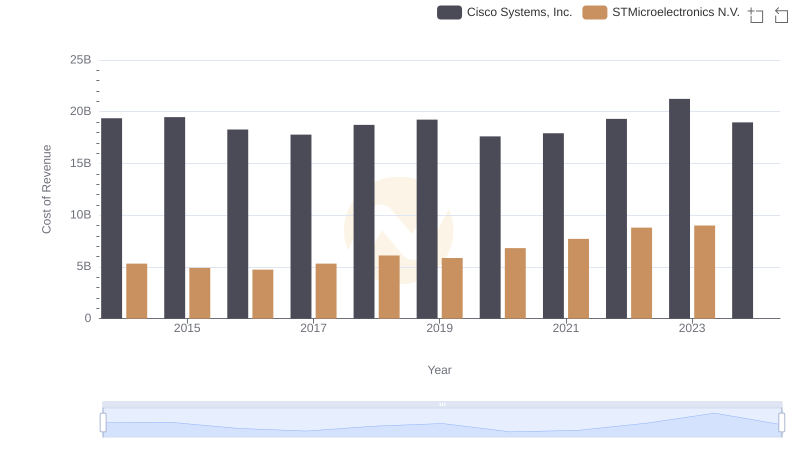
Cisco Systems, Inc. vs STMicroelectronics N.V.: Efficiency in Cost of Revenue Explored
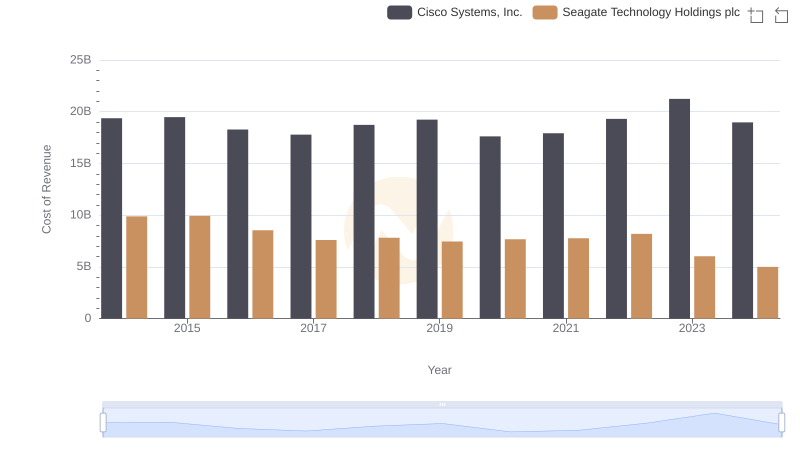
Analyzing Cost of Revenue: Cisco Systems, Inc. and Seagate Technology Holdings plc
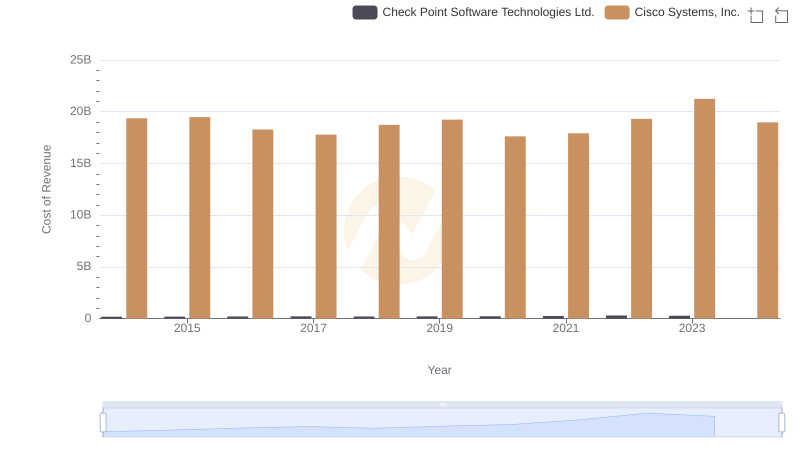
Cisco Systems, Inc. vs Check Point Software Technologies Ltd.: Efficiency in Cost of Revenue Explored
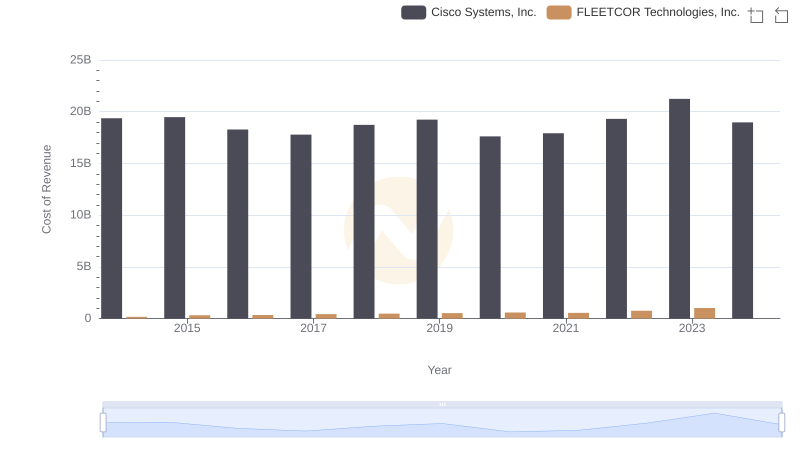
Cost Insights: Breaking Down Cisco Systems, Inc. and FLEETCOR Technologies, Inc.'s Expenses
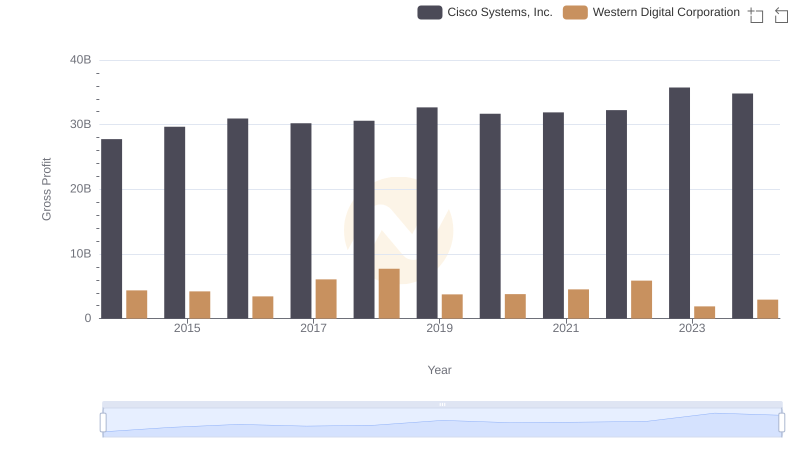
Cisco Systems, Inc. and Western Digital Corporation: A Detailed Gross Profit Analysis
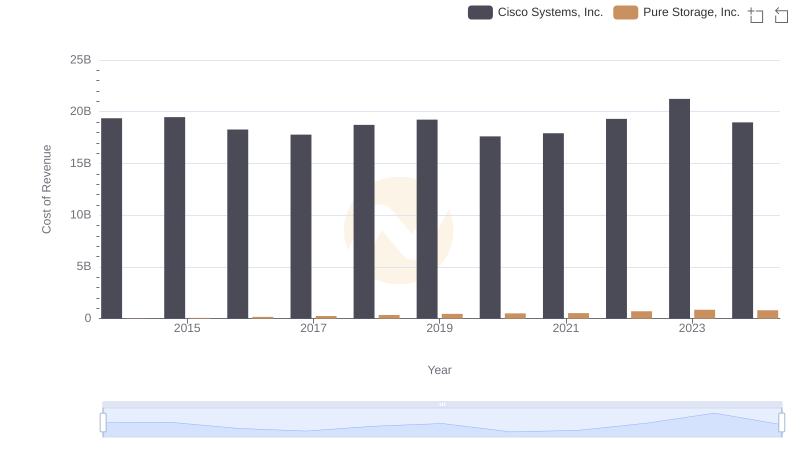
Cost of Revenue: Key Insights for Cisco Systems, Inc. and Pure Storage, Inc.
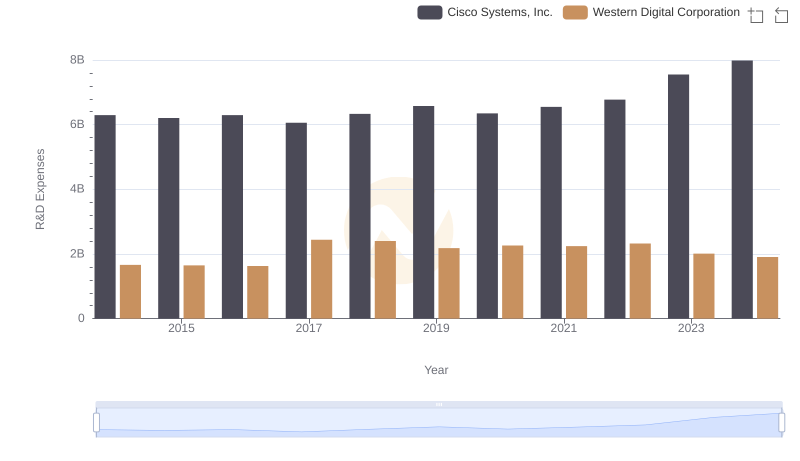
Comparing Innovation Spending: Cisco Systems, Inc. and Western Digital Corporation
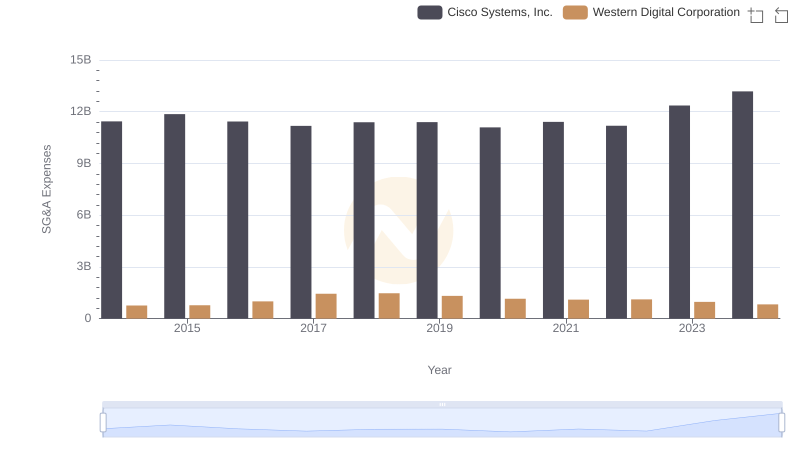
Breaking Down SG&A Expenses: Cisco Systems, Inc. vs Western Digital Corporation