| __timestamp | Cisco Systems, Inc. | PTC Inc. |
|---|---|---|
| Wednesday, January 1, 2014 | 47142000000 | 1356967000 |
| Thursday, January 1, 2015 | 49161000000 | 1255242000 |
| Friday, January 1, 2016 | 49247000000 | 1140533000 |
| Sunday, January 1, 2017 | 48005000000 | 1164039000 |
| Monday, January 1, 2018 | 49330000000 | 1241824000 |
| Tuesday, January 1, 2019 | 51904000000 | 1255631000 |
| Wednesday, January 1, 2020 | 49301000000 | 1458415000 |
| Friday, January 1, 2021 | 49818000000 | 1807159000 |
| Saturday, January 1, 2022 | 51557000000 | 1933347000 |
| Sunday, January 1, 2023 | 56998000000 | 2097053000 |
| Monday, January 1, 2024 | 53803000000 | 2298472000 |
Unleashing the power of data
In the ever-evolving tech landscape, Cisco Systems, Inc. and PTC Inc. have demonstrated remarkable resilience and growth over the past decade. From 2014 to 2024, Cisco's revenue surged by approximately 14%, peaking in 2023 with a 57 billion USD mark. This growth underscores Cisco's robust market position and strategic innovations.
Conversely, PTC Inc. has shown a dynamic growth trajectory, with its revenue nearly doubling over the same period. By 2024, PTC's revenue reached 2.3 billion USD, reflecting its successful adaptation to market demands and technological advancements.
This comprehensive analysis highlights the contrasting yet successful strategies of these two tech giants. While Cisco capitalizes on its established market presence, PTC's agile approach in niche markets has proven equally effective. As the tech industry continues to evolve, these companies exemplify the diverse paths to sustained growth and innovation.
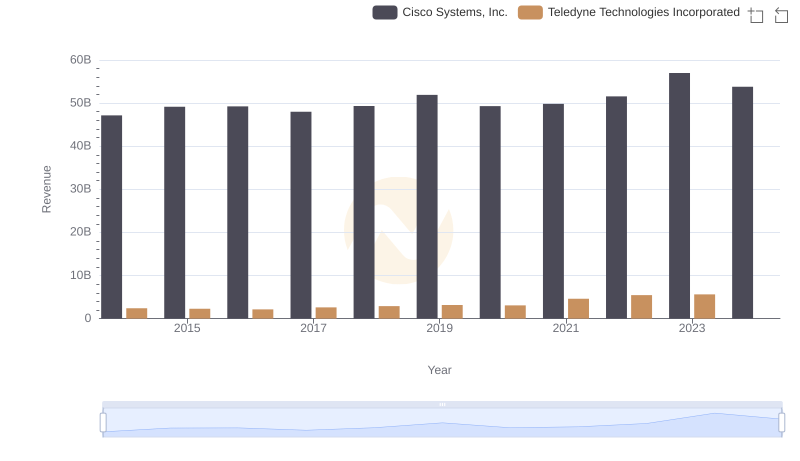
Cisco Systems, Inc. vs Teledyne Technologies Incorporated: Examining Key Revenue Metrics
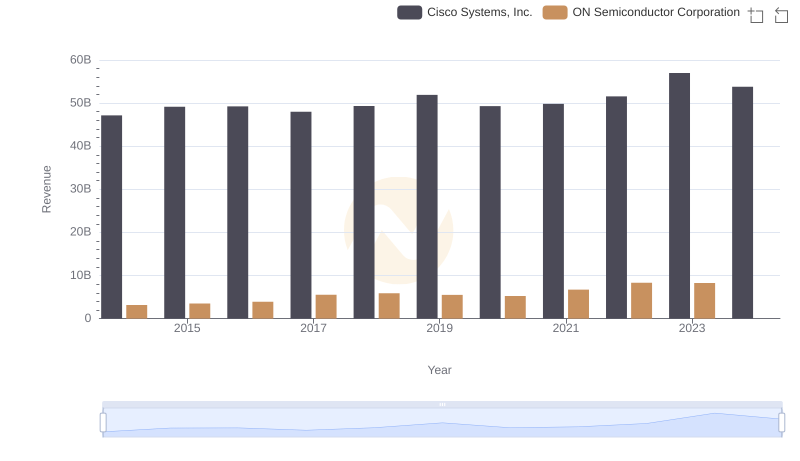
Cisco Systems, Inc. vs ON Semiconductor Corporation: Annual Revenue Growth Compared
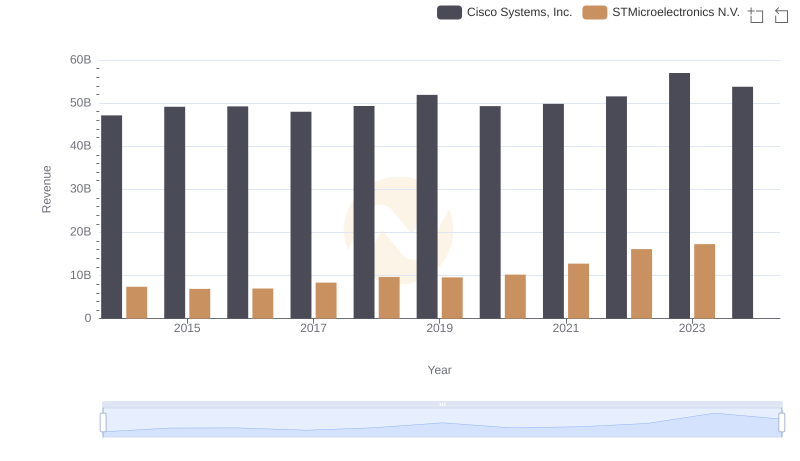
Cisco Systems, Inc. vs STMicroelectronics N.V.: Annual Revenue Growth Compared
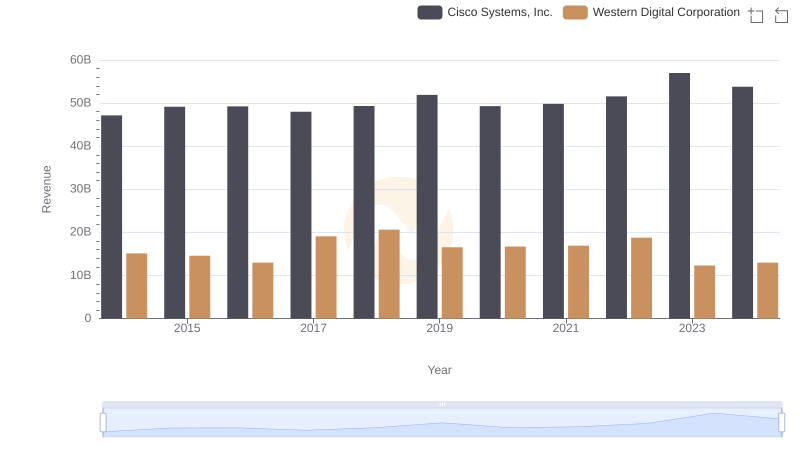
Who Generates More Revenue? Cisco Systems, Inc. or Western Digital Corporation
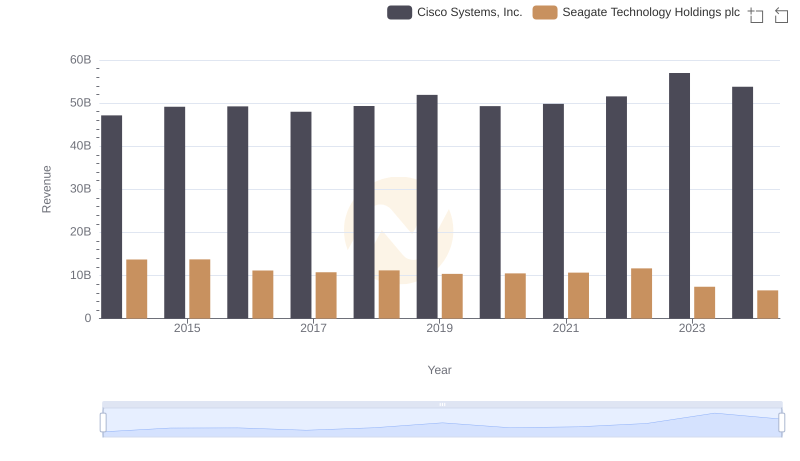
Cisco Systems, Inc. vs Seagate Technology Holdings plc: Examining Key Revenue Metrics
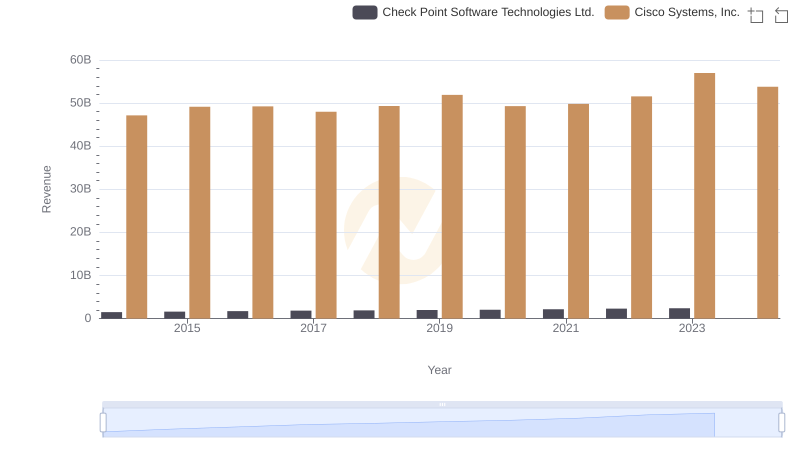
Annual Revenue Comparison: Cisco Systems, Inc. vs Check Point Software Technologies Ltd.
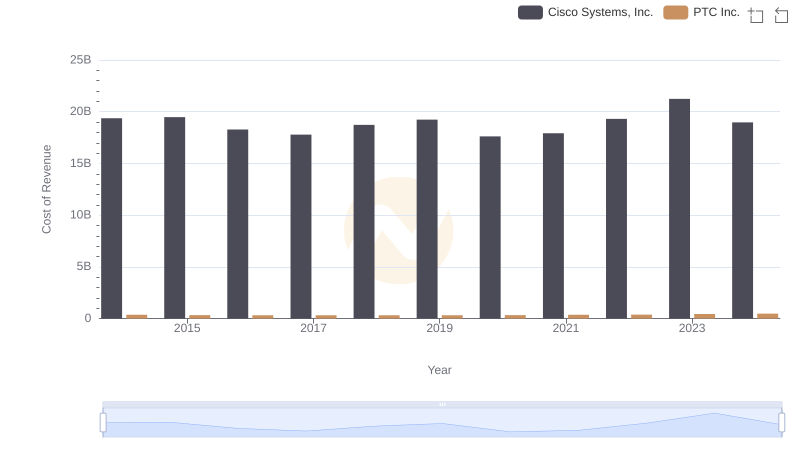
Cost Insights: Breaking Down Cisco Systems, Inc. and PTC Inc.'s Expenses
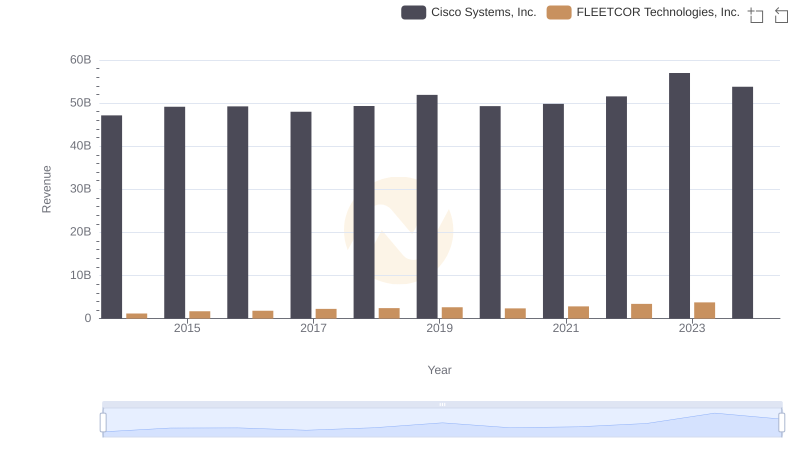
Revenue Insights: Cisco Systems, Inc. and FLEETCOR Technologies, Inc. Performance Compared
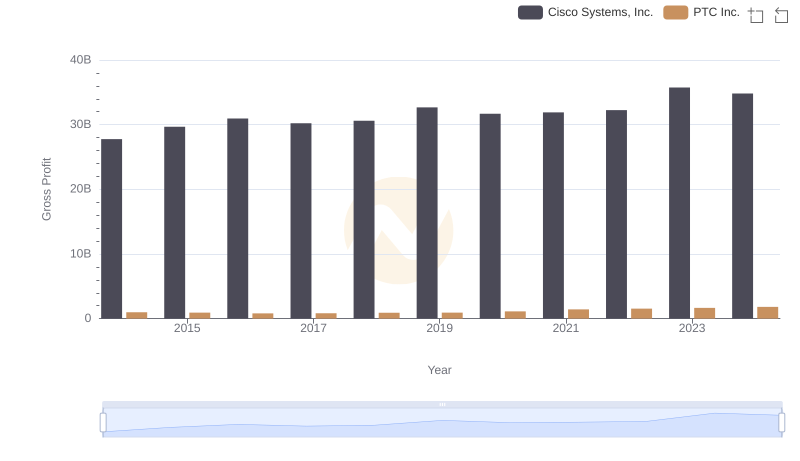
Who Generates Higher Gross Profit? Cisco Systems, Inc. or PTC Inc.
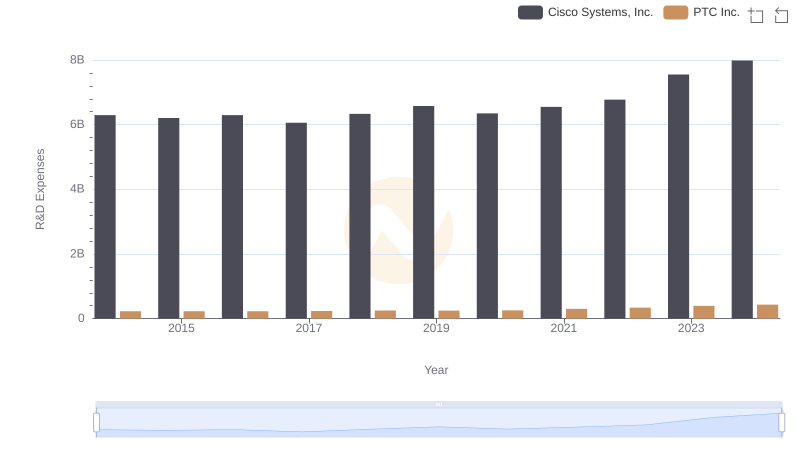
Research and Development Expenses Breakdown: Cisco Systems, Inc. vs PTC Inc.
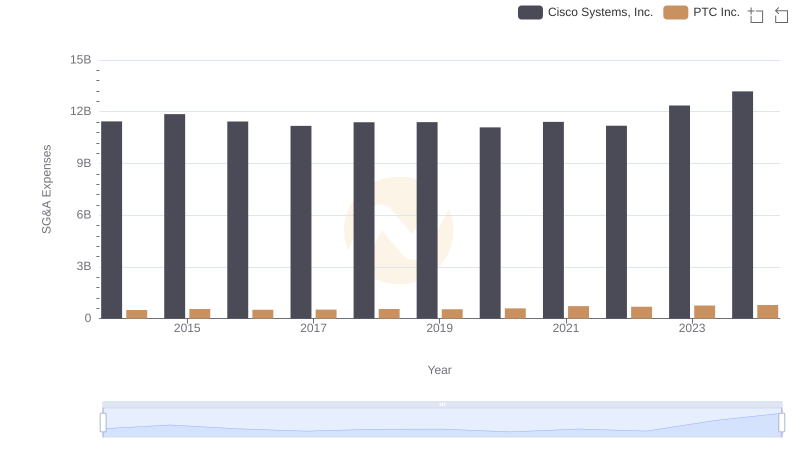
Cisco Systems, Inc. vs PTC Inc.: SG&A Expense Trends
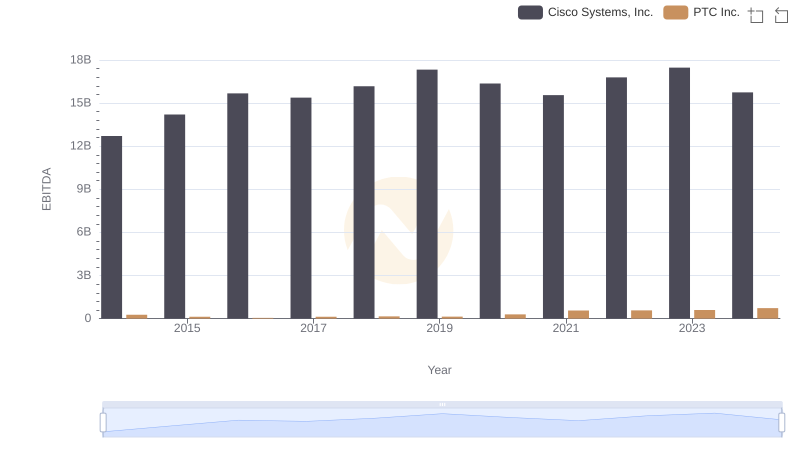
A Professional Review of EBITDA: Cisco Systems, Inc. Compared to PTC Inc.