| __timestamp | Cisco Systems, Inc. | Nokia Oyj |
|---|---|---|
| Wednesday, January 1, 2014 | 47142000000 | 12732000000 |
| Thursday, January 1, 2015 | 49161000000 | 12499000000 |
| Friday, January 1, 2016 | 49247000000 | 23614000000 |
| Sunday, January 1, 2017 | 48005000000 | 23147000000 |
| Monday, January 1, 2018 | 49330000000 | 22563000000 |
| Tuesday, January 1, 2019 | 51904000000 | 23315000000 |
| Wednesday, January 1, 2020 | 49301000000 | 21867000000 |
| Friday, January 1, 2021 | 49818000000 | 22202000000 |
| Saturday, January 1, 2022 | 51557000000 | 24911000000 |
| Sunday, January 1, 2023 | 56998000000 | 22258000000 |
| Monday, January 1, 2024 | 53803000000 |
Unleashing the power of data
In the ever-evolving tech landscape, Cisco Systems, Inc. and Nokia Oyj have been pivotal players. From 2014 to 2023, Cisco's revenue has shown a robust upward trend, peaking at approximately $57 billion in 2023, marking a 21% increase from 2014. In contrast, Nokia's revenue journey has been more volatile, with a notable dip in 2015 but a recovery to around $25 billion in 2022. This reflects a 96% increase from its lowest point in 2015. However, 2023 data for Nokia is missing, leaving a gap in the narrative. Cisco's consistent growth underscores its strategic adaptability, while Nokia's fluctuations highlight the challenges and opportunities in the telecommunications sector. As we look to the future, these trends offer insights into the competitive dynamics and strategic shifts within the industry.
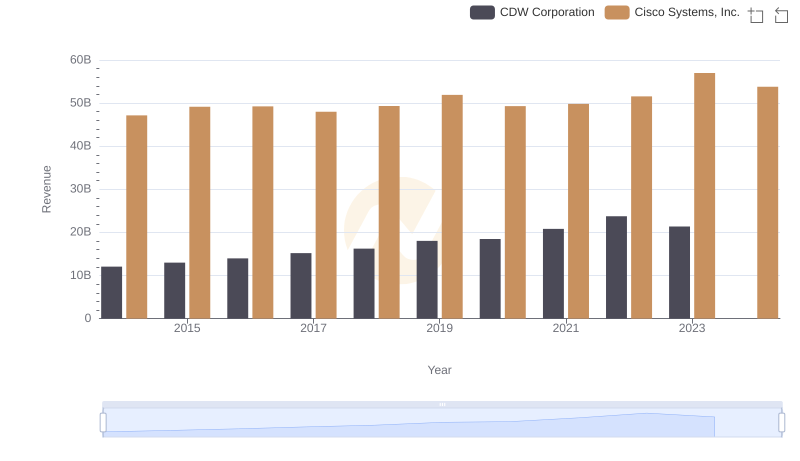
Cisco Systems, Inc. vs CDW Corporation: Annual Revenue Growth Compared

Cisco Systems, Inc. vs Telefonaktiebolaget LM Ericsson (publ): Examining Key Revenue Metrics
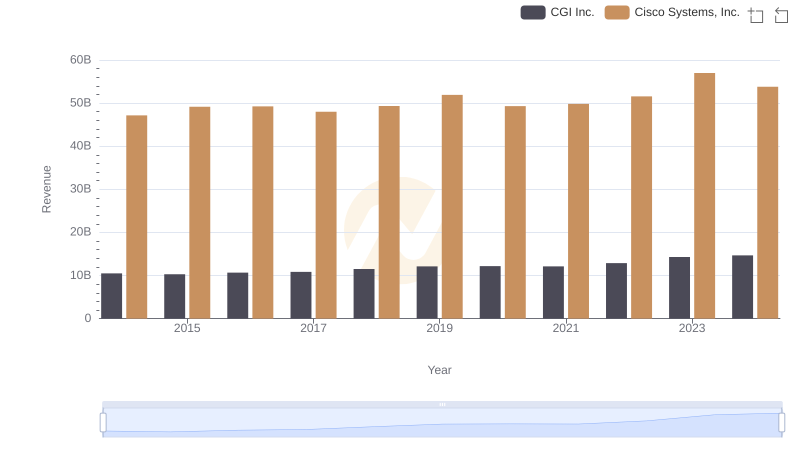
Revenue Insights: Cisco Systems, Inc. and CGI Inc. Performance Compared
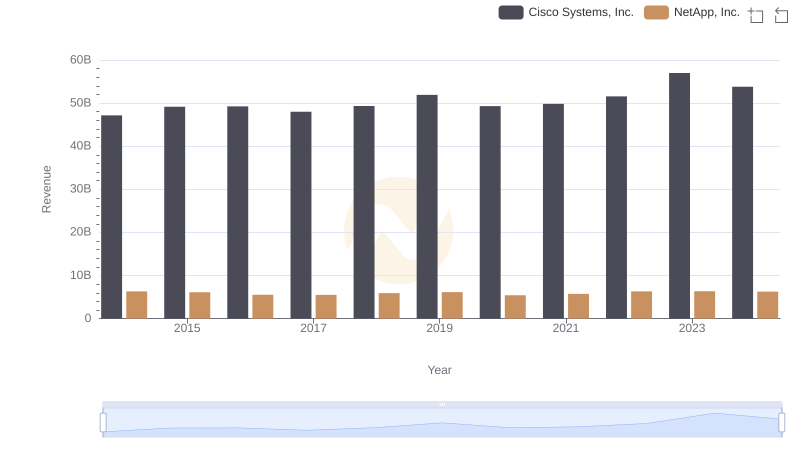
Who Generates More Revenue? Cisco Systems, Inc. or NetApp, Inc.
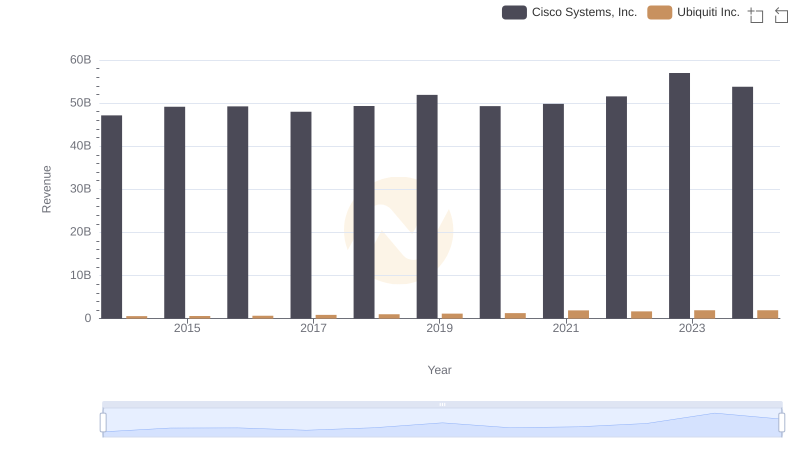
Revenue Insights: Cisco Systems, Inc. and Ubiquiti Inc. Performance Compared
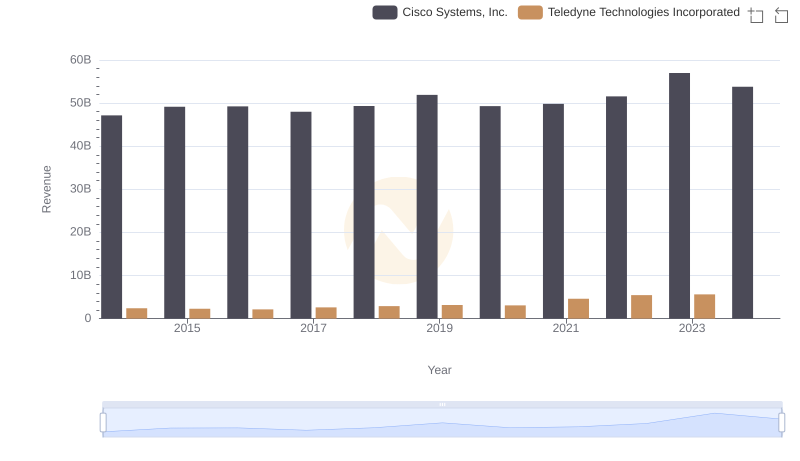
Cisco Systems, Inc. vs Teledyne Technologies Incorporated: Examining Key Revenue Metrics
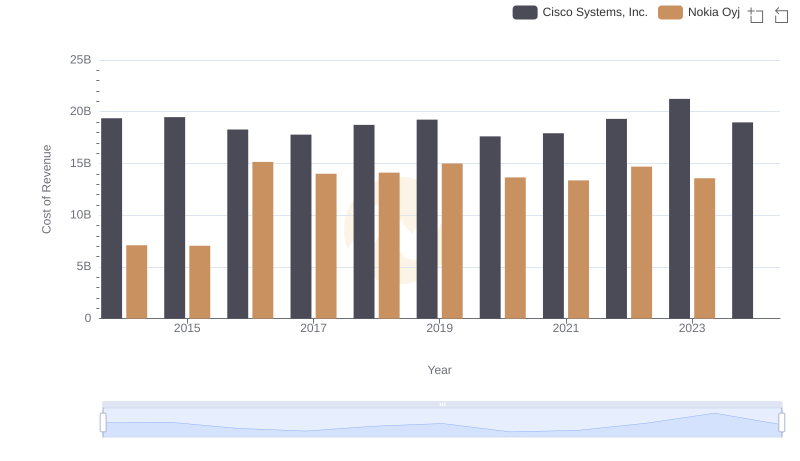
Cost Insights: Breaking Down Cisco Systems, Inc. and Nokia Oyj's Expenses
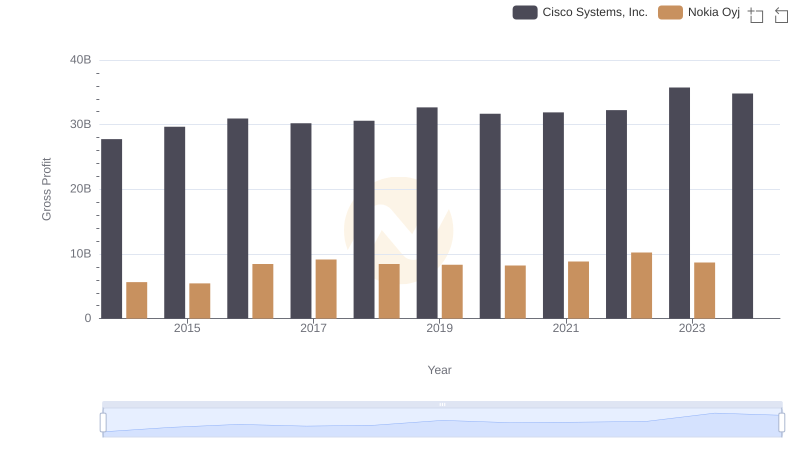
Gross Profit Comparison: Cisco Systems, Inc. and Nokia Oyj Trends
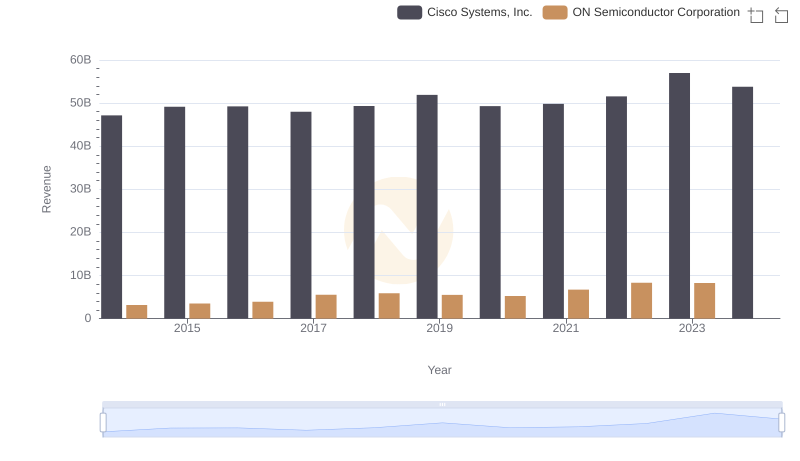
Cisco Systems, Inc. vs ON Semiconductor Corporation: Annual Revenue Growth Compared
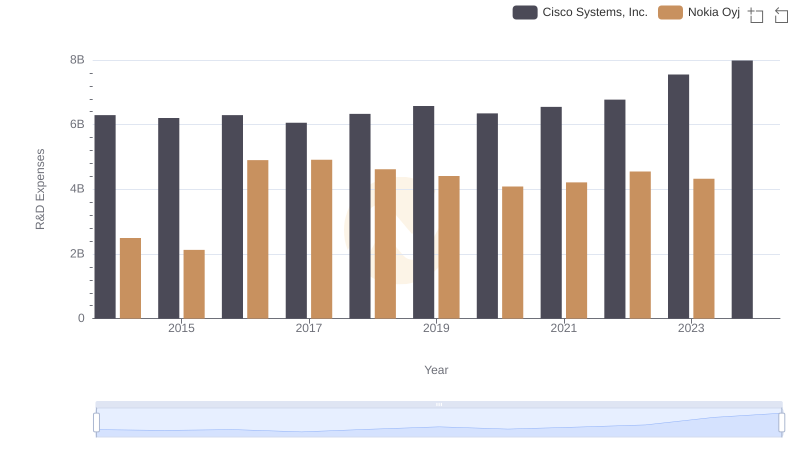
Research and Development: Comparing Key Metrics for Cisco Systems, Inc. and Nokia Oyj
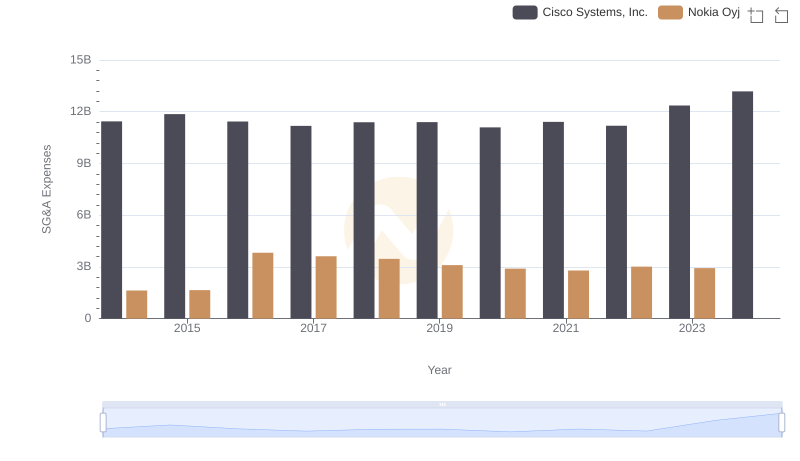
Cisco Systems, Inc. or Nokia Oyj: Who Manages SG&A Costs Better?
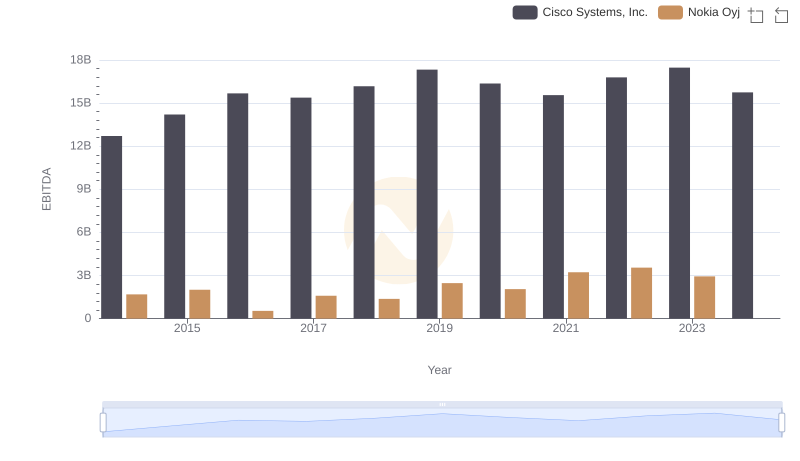
Professional EBITDA Benchmarking: Cisco Systems, Inc. vs Nokia Oyj