| __timestamp | Cintas Corporation | Old Dominion Freight Line, Inc. |
|---|---|---|
| Wednesday, January 1, 2014 | 2637426000 | 2100409000 |
| Thursday, January 1, 2015 | 2555549000 | 2214943000 |
| Friday, January 1, 2016 | 2775588000 | 2246890000 |
| Sunday, January 1, 2017 | 2943086000 | 2482732000 |
| Monday, January 1, 2018 | 3568109000 | 2899452000 |
| Tuesday, January 1, 2019 | 3763715000 | 2938895000 |
| Wednesday, January 1, 2020 | 3851372000 | 2786531000 |
| Friday, January 1, 2021 | 3801689000 | 3481268000 |
| Saturday, January 1, 2022 | 4222213000 | 4003951000 |
| Sunday, January 1, 2023 | 4642401000 | 3793953000 |
| Monday, January 1, 2024 | 4910199000 |
Data in motion
In the ever-evolving landscape of corporate expenses, understanding cost trends is crucial for investors and analysts alike. This analysis delves into the cost of revenue for two industry giants: Cintas Corporation and Old Dominion Freight Line, Inc., from 2014 to 2023.
Cintas Corporation has shown a consistent upward trajectory in its cost of revenue, with a notable increase of approximately 86% over the decade. This growth reflects the company's expanding operations and market reach.
Old Dominion Freight Line, Inc. experienced a more volatile pattern, with costs peaking in 2022. Despite a dip in 2023, the company still managed a 80% increase since 2014.
It's important to note the absence of data for Old Dominion in 2024, which could impact future trend analysis.
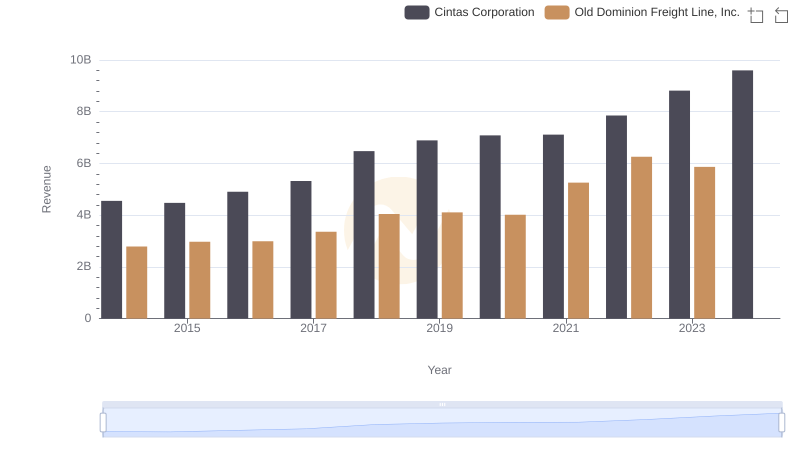
Revenue Insights: Cintas Corporation and Old Dominion Freight Line, Inc. Performance Compared
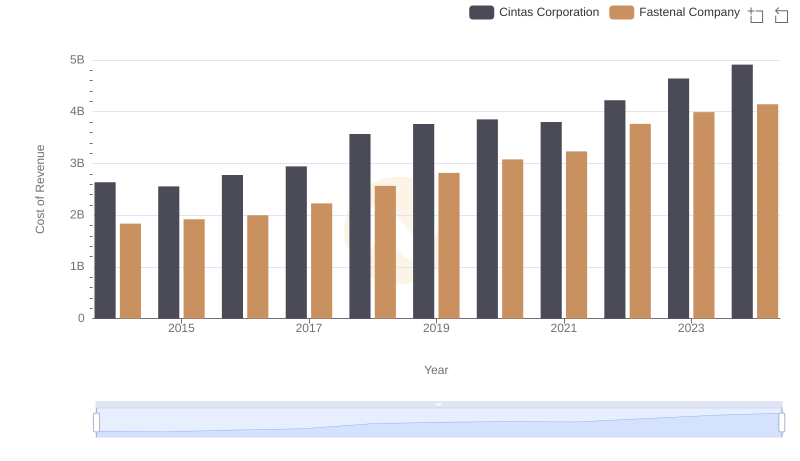
Cost of Revenue Trends: Cintas Corporation vs Fastenal Company
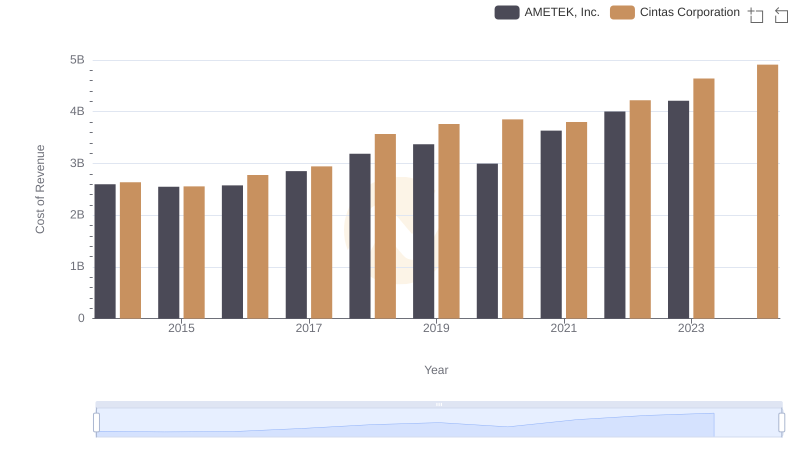
Analyzing Cost of Revenue: Cintas Corporation and AMETEK, Inc.
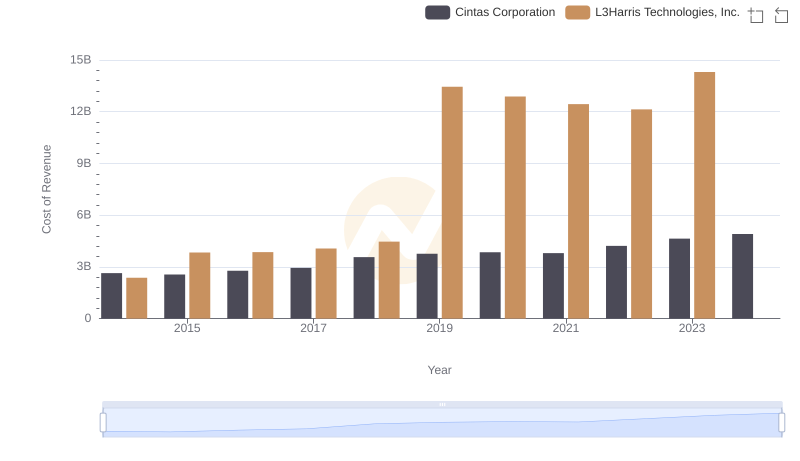
Analyzing Cost of Revenue: Cintas Corporation and L3Harris Technologies, Inc.
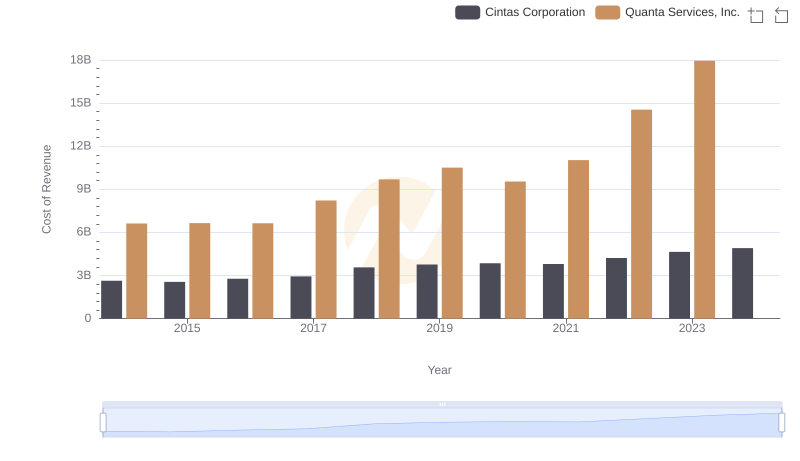
Analyzing Cost of Revenue: Cintas Corporation and Quanta Services, Inc.
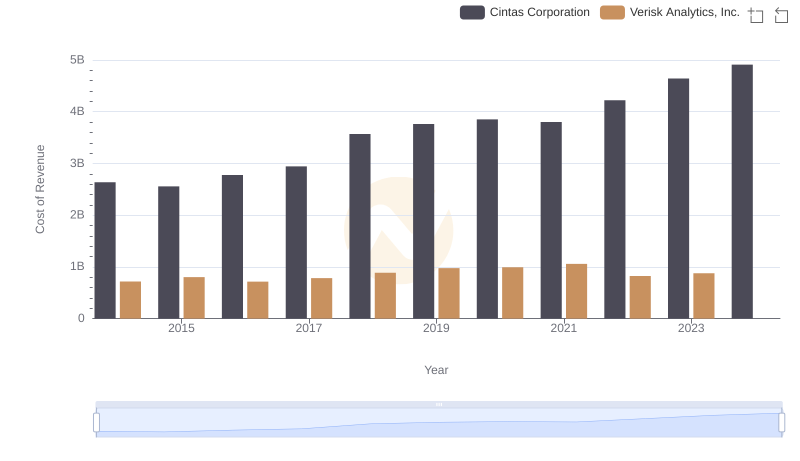
Cost Insights: Breaking Down Cintas Corporation and Verisk Analytics, Inc.'s Expenses
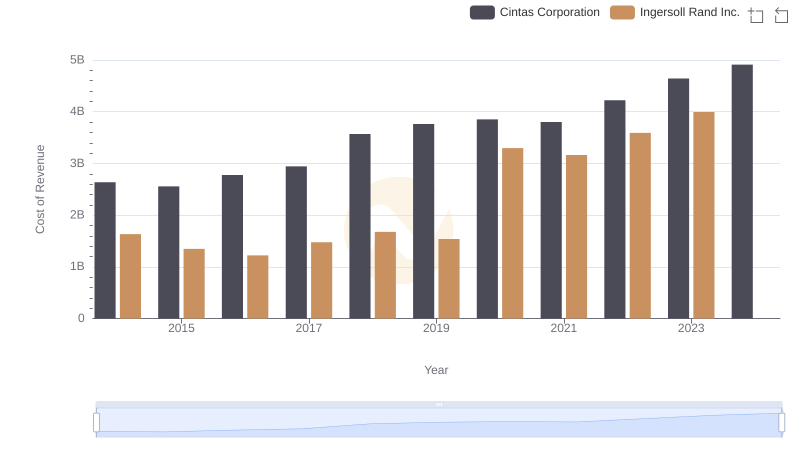
Cost Insights: Breaking Down Cintas Corporation and Ingersoll Rand Inc.'s Expenses
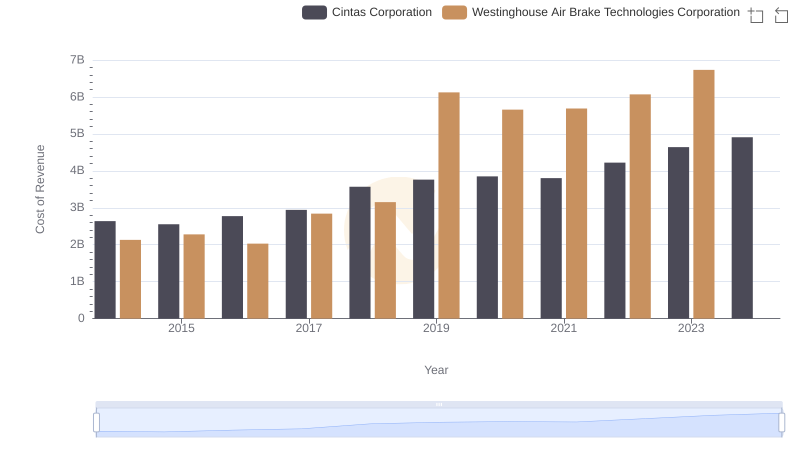
Cost of Revenue Comparison: Cintas Corporation vs Westinghouse Air Brake Technologies Corporation

Cintas Corporation vs United Airlines Holdings, Inc.: Efficiency in Cost of Revenue Explored
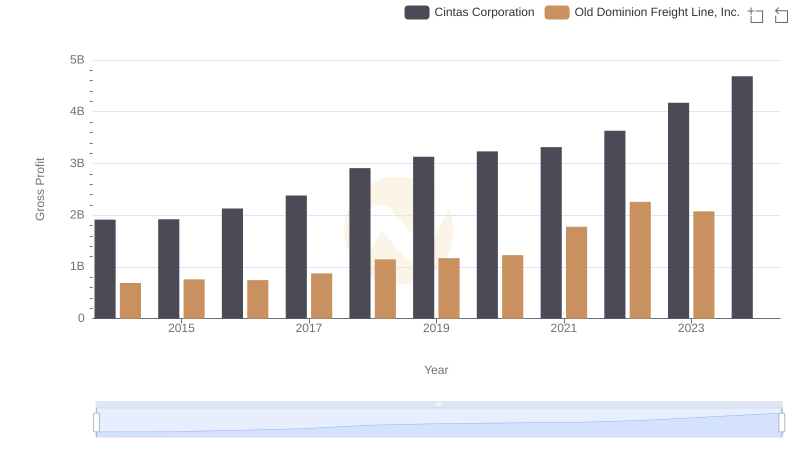
Gross Profit Analysis: Comparing Cintas Corporation and Old Dominion Freight Line, Inc.
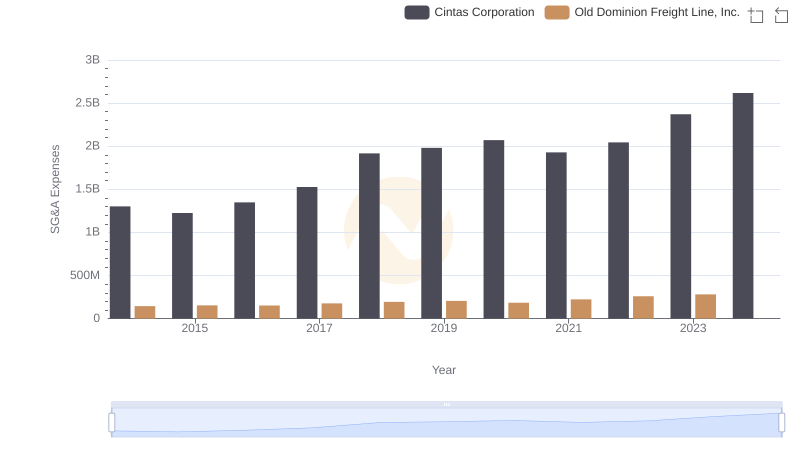
Selling, General, and Administrative Costs: Cintas Corporation vs Old Dominion Freight Line, Inc.
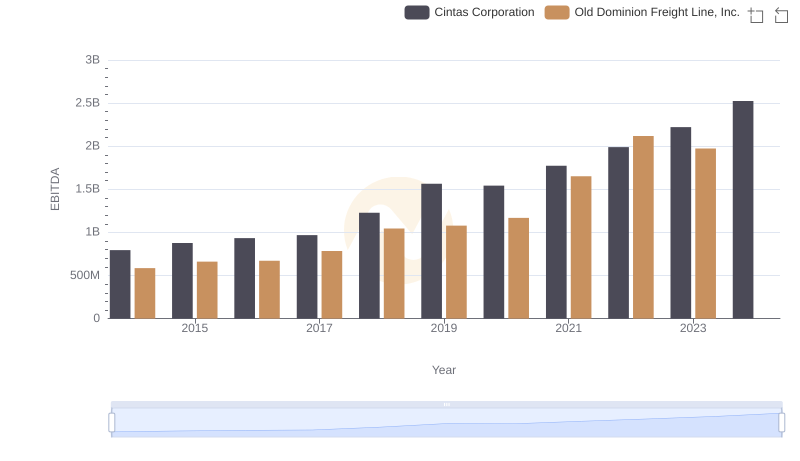
Professional EBITDA Benchmarking: Cintas Corporation vs Old Dominion Freight Line, Inc.