| __timestamp | Cintas Corporation | ITT Inc. |
|---|---|---|
| Wednesday, January 1, 2014 | 1302752000 | 519500000 |
| Thursday, January 1, 2015 | 1224930000 | 441500000 |
| Friday, January 1, 2016 | 1348122000 | 444100000 |
| Sunday, January 1, 2017 | 1527380000 | 433700000 |
| Monday, January 1, 2018 | 1916792000 | 427300000 |
| Tuesday, January 1, 2019 | 1980644000 | 420000000 |
| Wednesday, January 1, 2020 | 2071052000 | 347200000 |
| Friday, January 1, 2021 | 1929159000 | 365100000 |
| Saturday, January 1, 2022 | 2044876000 | 368500000 |
| Sunday, January 1, 2023 | 2370704000 | 476600000 |
| Monday, January 1, 2024 | 2617783000 | 502300000 |
Unleashing insights
In the ever-evolving landscape of corporate finance, understanding operational costs is crucial. This analysis delves into the Selling, General, and Administrative (SG&A) expenses of two industry giants: Cintas Corporation and ITT Inc., from 2014 to 2023.
Cintas Corporation has shown a remarkable upward trend in SG&A expenses, increasing by approximately 101% over the decade. This growth reflects its expanding operations and market reach. In contrast, ITT Inc. experienced a more modest fluctuation, with a peak in 2014 and a notable dip in 2020, before stabilizing around 2023.
While Cintas continues its upward trajectory into 2024, ITT's data for the same year remains unavailable, leaving room for speculation on its future financial strategies. This comparative analysis highlights the dynamic nature of operational costs and their impact on corporate growth strategies.
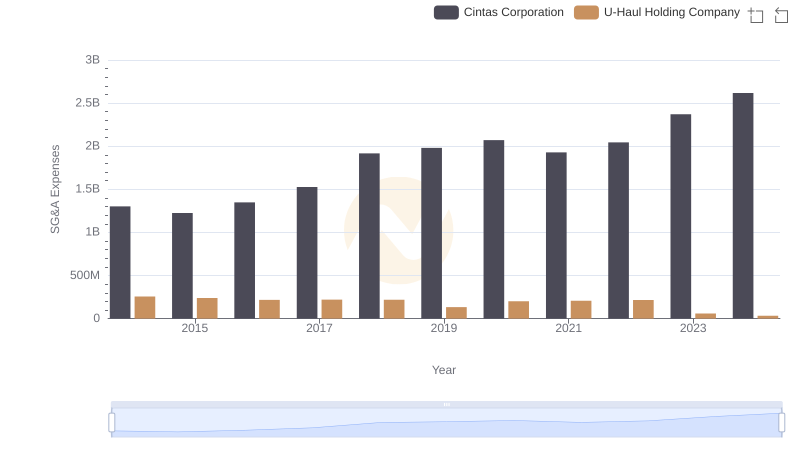
Cintas Corporation vs U-Haul Holding Company: SG&A Expense Trends
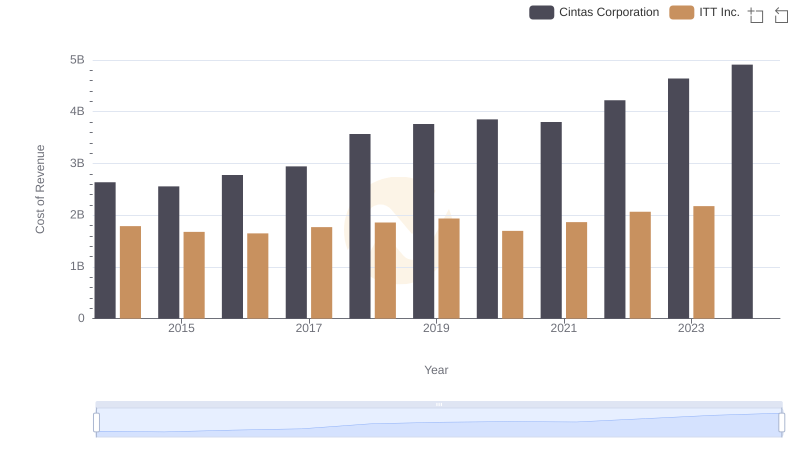
Cost Insights: Breaking Down Cintas Corporation and ITT Inc.'s Expenses
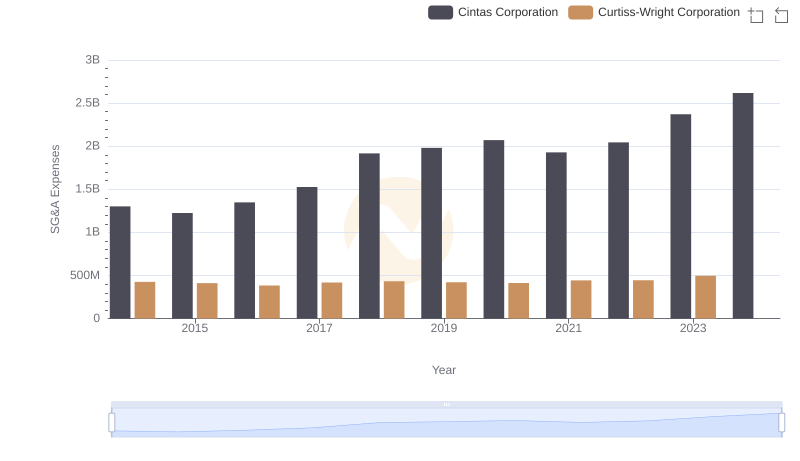
Who Optimizes SG&A Costs Better? Cintas Corporation or Curtiss-Wright Corporation
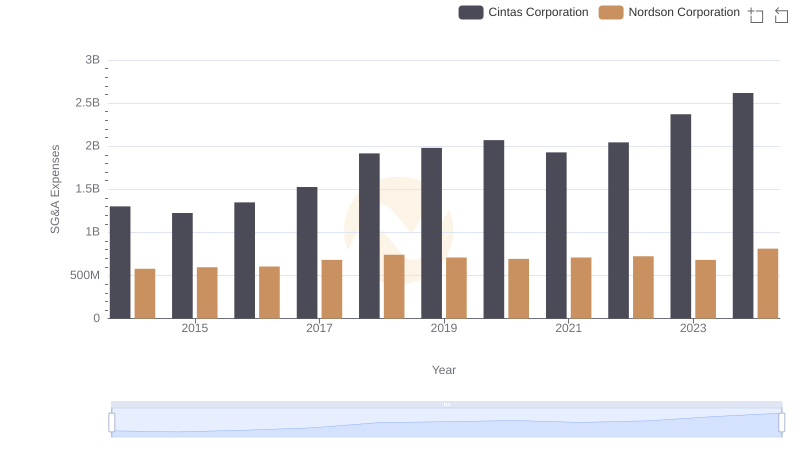
Breaking Down SG&A Expenses: Cintas Corporation vs Nordson Corporation
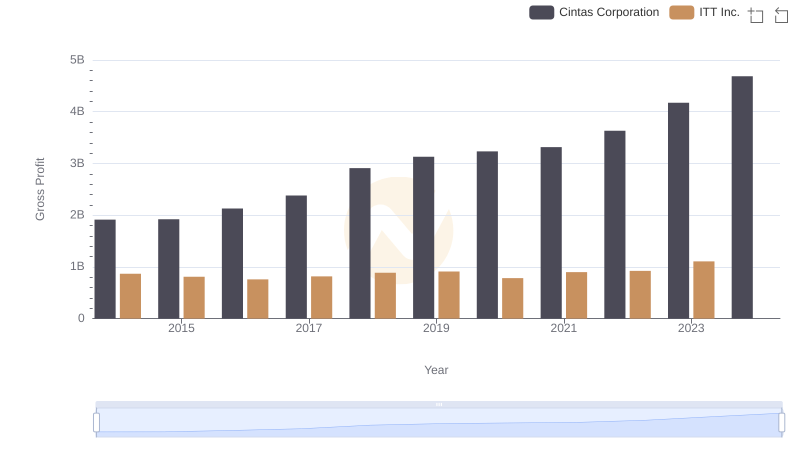
Cintas Corporation and ITT Inc.: A Detailed Gross Profit Analysis
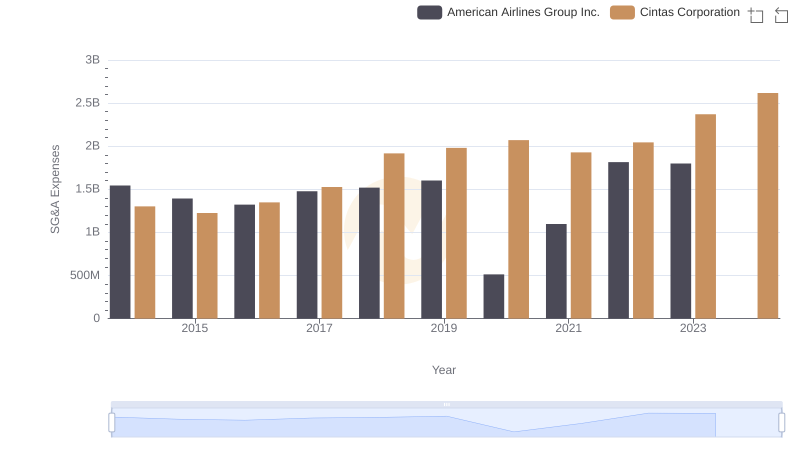
Cintas Corporation or American Airlines Group Inc.: Who Manages SG&A Costs Better?