| __timestamp | Cintas Corporation | ITT Inc. |
|---|---|---|
| Wednesday, January 1, 2014 | 1914386000 | 866400000 |
| Thursday, January 1, 2015 | 1921337000 | 809100000 |
| Friday, January 1, 2016 | 2129870000 | 758200000 |
| Sunday, January 1, 2017 | 2380295000 | 817200000 |
| Monday, January 1, 2018 | 2908523000 | 887200000 |
| Tuesday, January 1, 2019 | 3128588000 | 910100000 |
| Wednesday, January 1, 2020 | 3233748000 | 782200000 |
| Friday, January 1, 2021 | 3314651000 | 899500000 |
| Saturday, January 1, 2022 | 3632246000 | 922300000 |
| Sunday, January 1, 2023 | 4173368000 | 1107300000 |
| Monday, January 1, 2024 | 4686416000 | 1247300000 |
In pursuit of knowledge
In the competitive landscape of corporate America, Cintas Corporation and ITT Inc. have carved distinct paths in their financial journeys. Over the past decade, Cintas has demonstrated a robust growth trajectory, with its gross profit surging by approximately 145% from 2014 to 2023. This impressive growth reflects Cintas's strategic expansions and operational efficiencies.
Conversely, ITT Inc. has experienced a more modest increase in gross profit, growing by about 28% over the same period. While ITT's growth is steady, it highlights the challenges faced in a competitive market. Notably, data for ITT in 2024 is missing, suggesting potential volatility or reporting delays.
This analysis underscores the dynamic nature of the business environment, where strategic decisions and market conditions can significantly impact financial outcomes. Investors and stakeholders should consider these trends when evaluating future prospects.
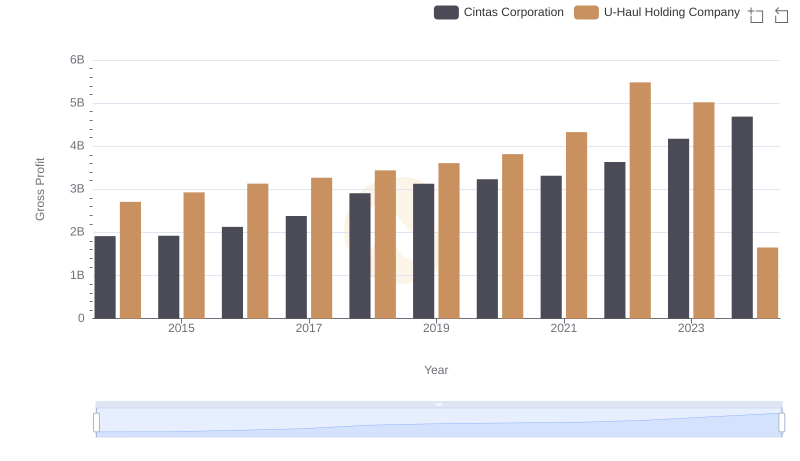
Gross Profit Analysis: Comparing Cintas Corporation and U-Haul Holding Company

Who Generates Higher Gross Profit? Cintas Corporation or Curtiss-Wright Corporation
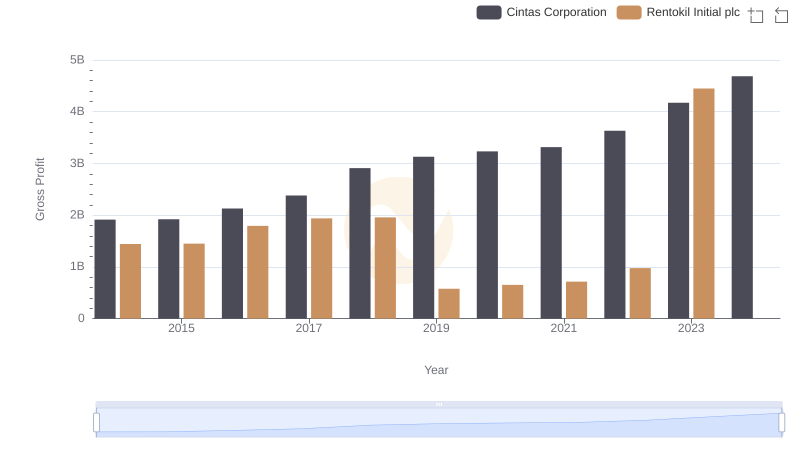
Gross Profit Trends Compared: Cintas Corporation vs Rentokil Initial plc
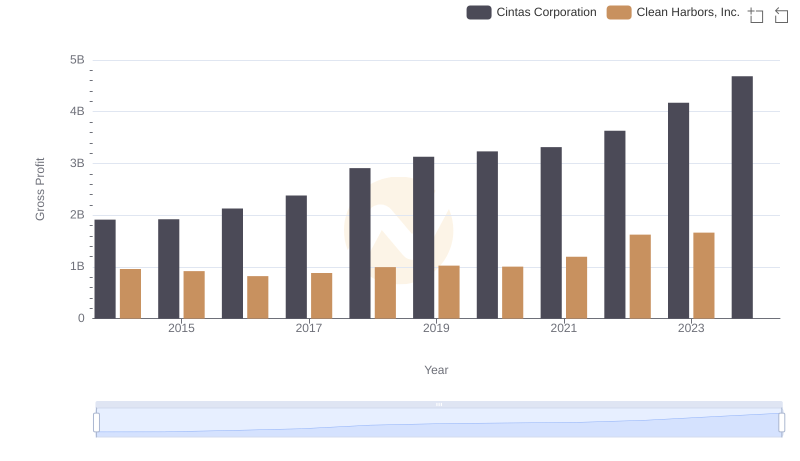
Gross Profit Trends Compared: Cintas Corporation vs Clean Harbors, Inc.
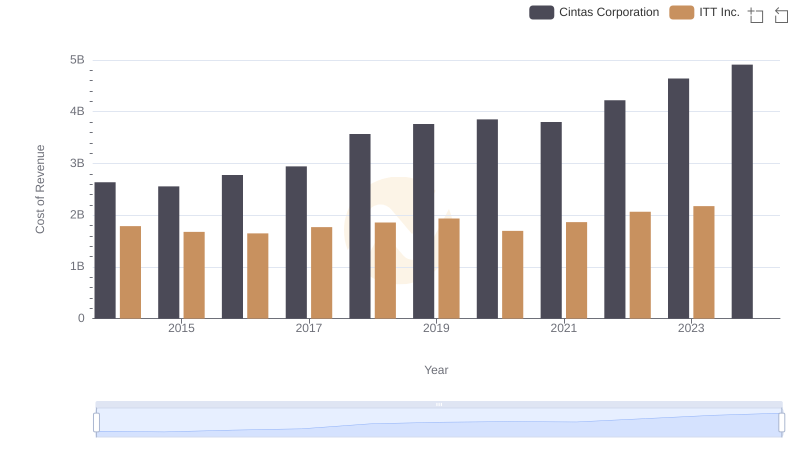
Cost Insights: Breaking Down Cintas Corporation and ITT Inc.'s Expenses
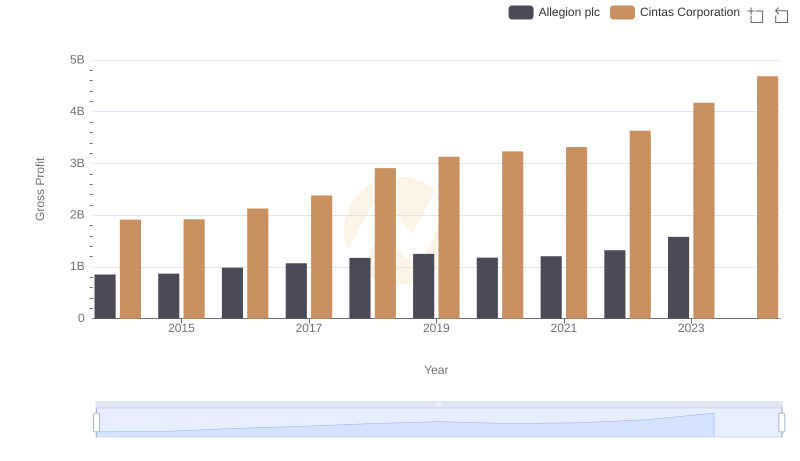
Gross Profit Trends Compared: Cintas Corporation vs Allegion plc
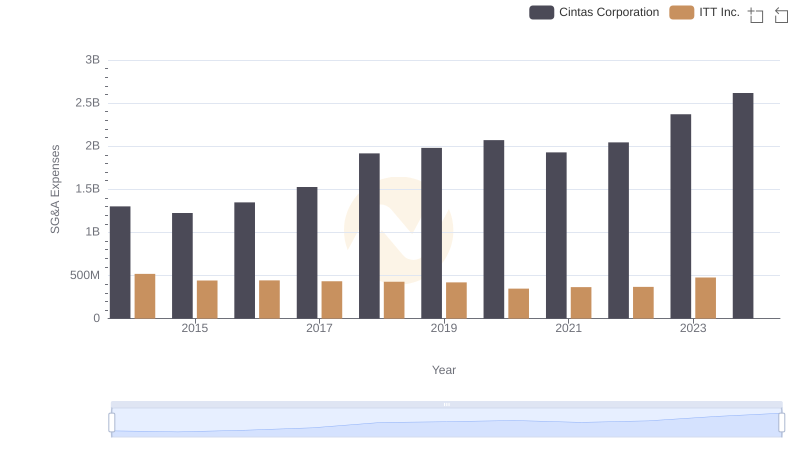
Operational Costs Compared: SG&A Analysis of Cintas Corporation and ITT Inc.