| __timestamp | Gen Digital Inc. | International Business Machines Corporation |
|---|---|---|
| Wednesday, January 1, 2014 | 1149000000 | 46386000000 |
| Thursday, January 1, 2015 | 1153000000 | 41057000000 |
| Friday, January 1, 2016 | 615000000 | 41403000000 |
| Sunday, January 1, 2017 | 853000000 | 42196000000 |
| Monday, January 1, 2018 | 1032000000 | 42655000000 |
| Tuesday, January 1, 2019 | 1050000000 | 26181000000 |
| Wednesday, January 1, 2020 | 393000000 | 24314000000 |
| Friday, January 1, 2021 | 362000000 | 25865000000 |
| Saturday, January 1, 2022 | 408000000 | 27842000000 |
| Sunday, January 1, 2023 | 589000000 | 27560000000 |
| Monday, January 1, 2024 | 731000000 | 27202000000 |
Unlocking the unknown
In the ever-evolving landscape of technology, understanding cost structures is crucial. Over the past decade, International Business Machines Corporation (IBM) and Gen Digital Inc. have showcased contrasting trends in their cost of revenue. IBM, a stalwart in the tech industry, saw its cost of revenue decrease by approximately 41% from 2014 to 2023, reflecting strategic shifts and operational efficiencies. In contrast, Gen Digital Inc., a rising player, experienced a 36% decline in cost of revenue from 2014 to 2020, followed by a resurgence, reaching 64% of its 2014 levels by 2024. This divergence highlights IBM's focus on streamlining operations, while Gen Digital Inc. navigates growth and market expansion. Notably, data for IBM in 2024 is missing, indicating potential shifts or reporting changes. These insights offer a window into the strategic maneuvers of two influential tech companies.
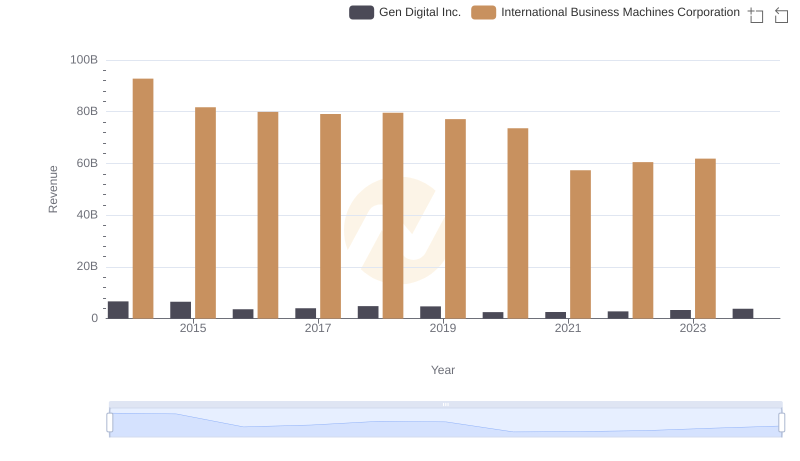
Revenue Insights: International Business Machines Corporation and Gen Digital Inc. Performance Compared
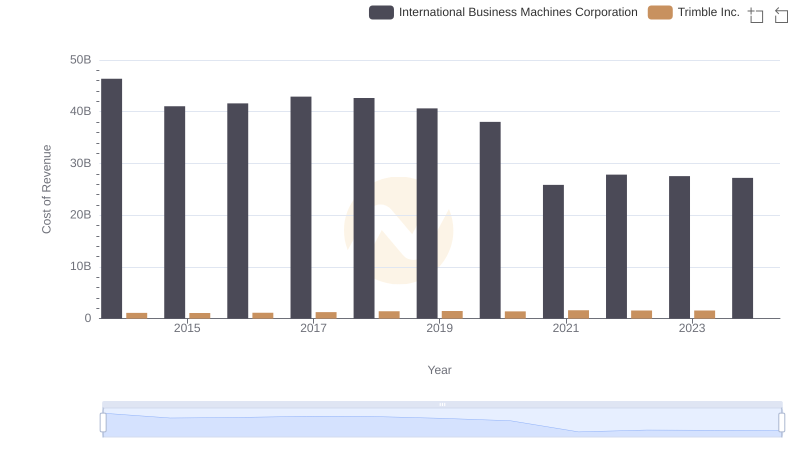
International Business Machines Corporation vs Trimble Inc.: Efficiency in Cost of Revenue Explored
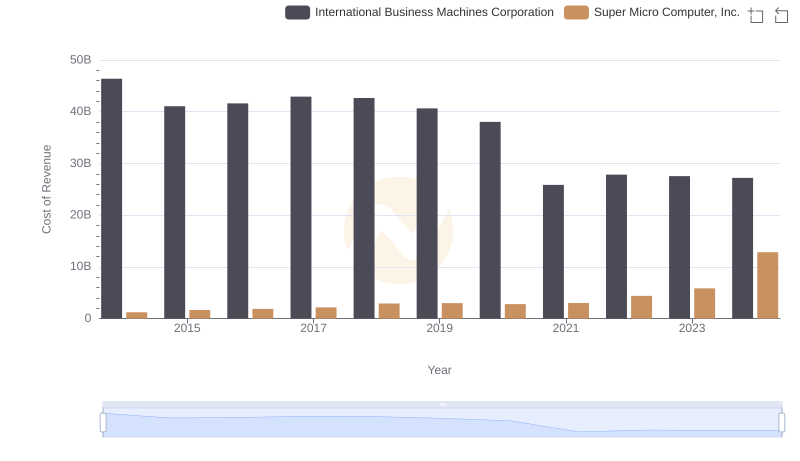
Cost of Revenue Trends: International Business Machines Corporation vs Super Micro Computer, Inc.
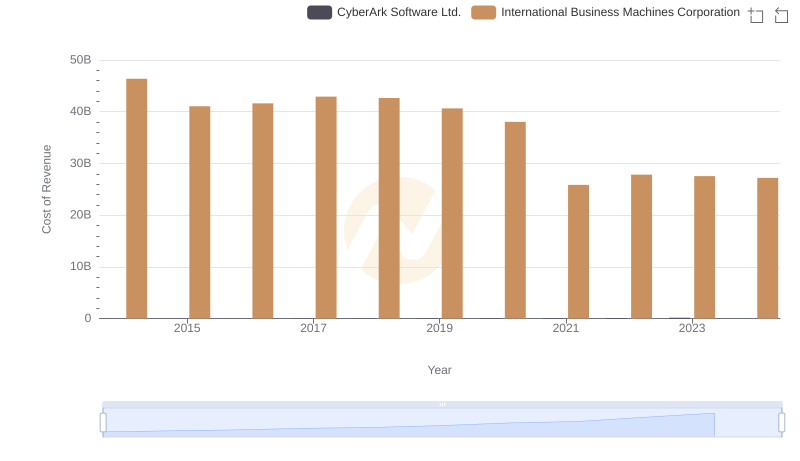
International Business Machines Corporation vs CyberArk Software Ltd.: Efficiency in Cost of Revenue Explored
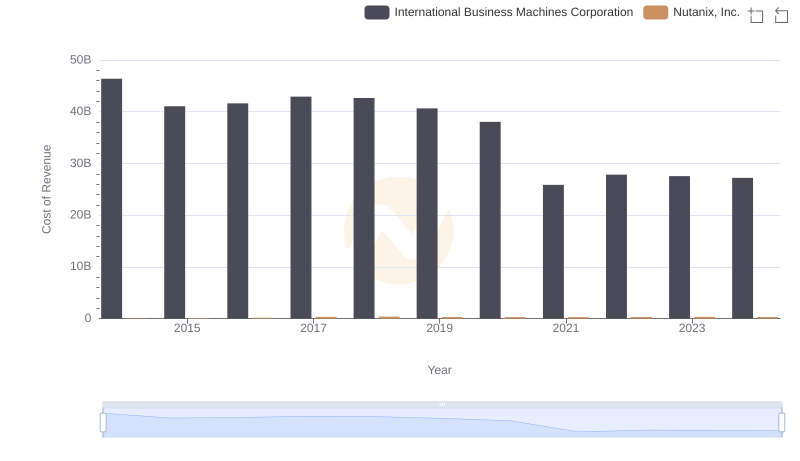
Analyzing Cost of Revenue: International Business Machines Corporation and Nutanix, Inc.
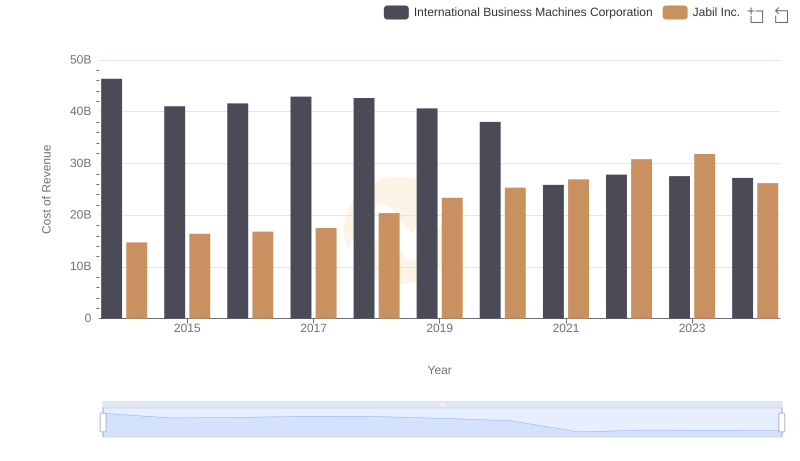
Analyzing Cost of Revenue: International Business Machines Corporation and Jabil Inc.
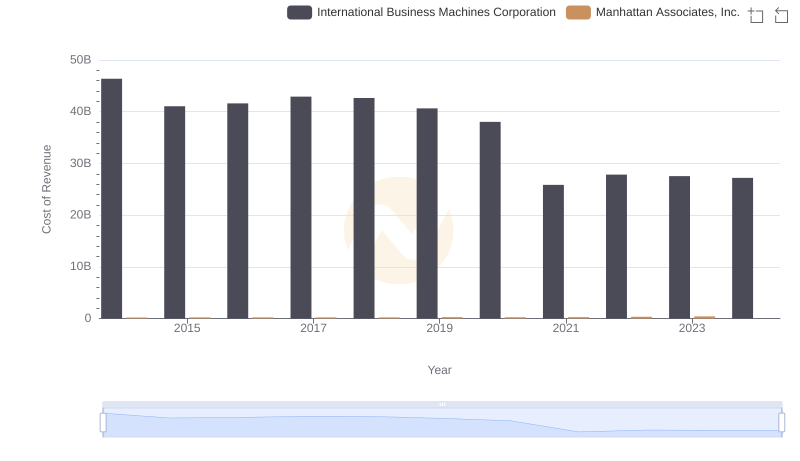
Comparing Cost of Revenue Efficiency: International Business Machines Corporation vs Manhattan Associates, Inc.
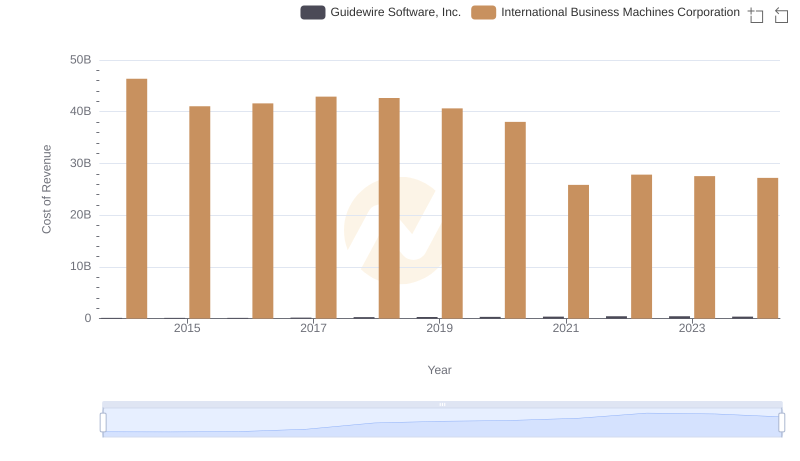
International Business Machines Corporation vs Guidewire Software, Inc.: Efficiency in Cost of Revenue Explored
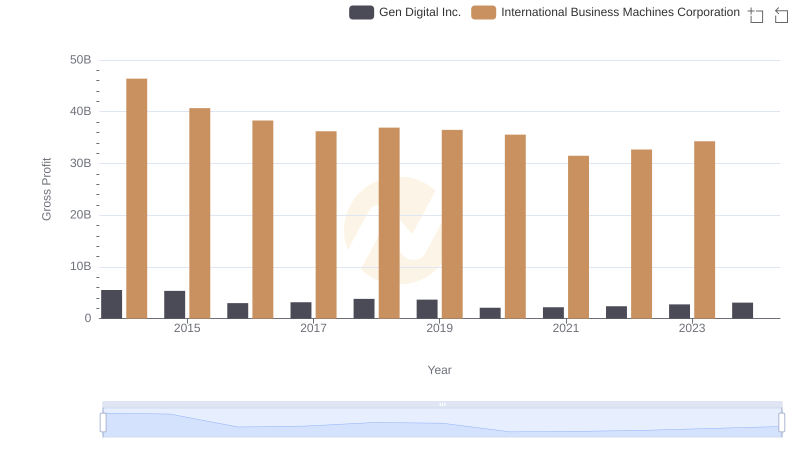
Gross Profit Analysis: Comparing International Business Machines Corporation and Gen Digital Inc.
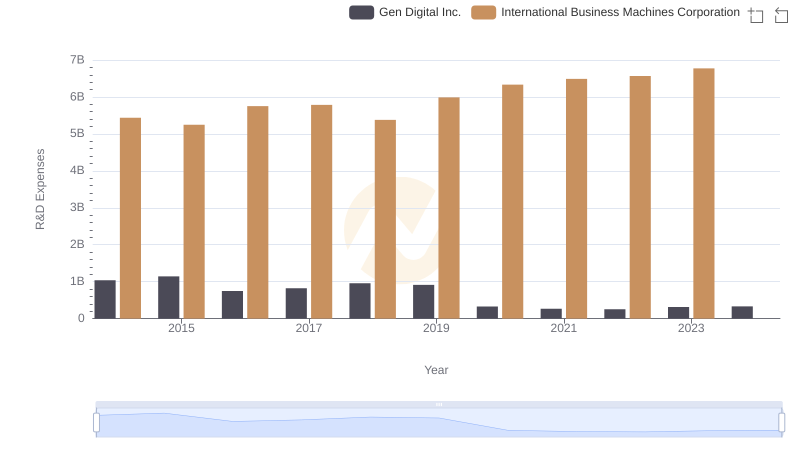
International Business Machines Corporation or Gen Digital Inc.: Who Invests More in Innovation?
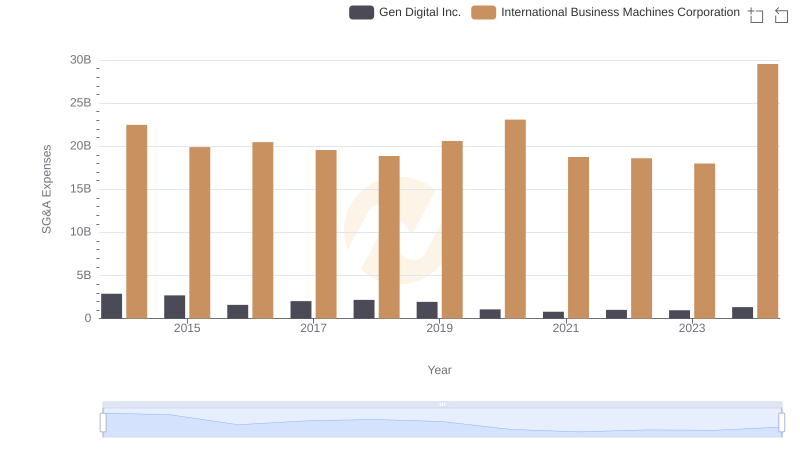
Selling, General, and Administrative Costs: International Business Machines Corporation vs Gen Digital Inc.
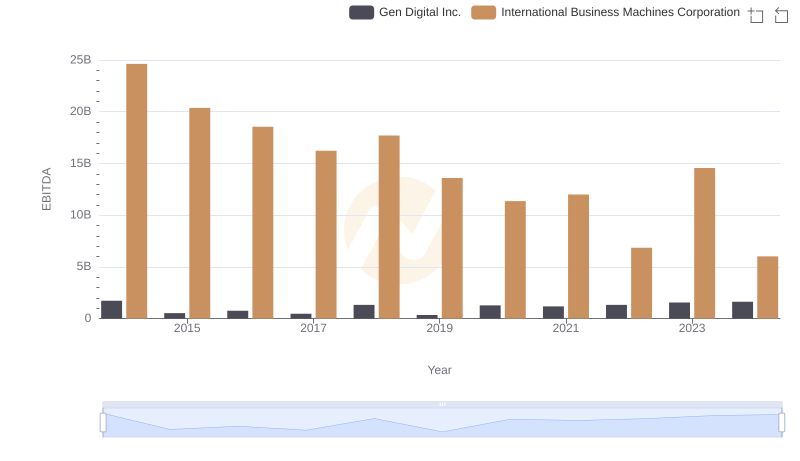
Comprehensive EBITDA Comparison: International Business Machines Corporation vs Gen Digital Inc.