| __timestamp | Gen Digital Inc. | International Business Machines Corporation |
|---|---|---|
| Wednesday, January 1, 2014 | 6676000000 | 92793000000 |
| Thursday, January 1, 2015 | 6508000000 | 81742000000 |
| Friday, January 1, 2016 | 3600000000 | 79920000000 |
| Sunday, January 1, 2017 | 4019000000 | 79139000000 |
| Monday, January 1, 2018 | 4846000000 | 79591000000 |
| Tuesday, January 1, 2019 | 4731000000 | 57714000000 |
| Wednesday, January 1, 2020 | 2490000000 | 55179000000 |
| Friday, January 1, 2021 | 2551000000 | 57351000000 |
| Saturday, January 1, 2022 | 2796000000 | 60530000000 |
| Sunday, January 1, 2023 | 3338000000 | 61860000000 |
| Monday, January 1, 2024 | 3812000000 | 62753000000 |
Unleashing the power of data
In the ever-evolving landscape of technology, revenue performance is a key indicator of a company's market position and strategic direction. Over the past decade, International Business Machines Corporation (IBM) and Gen Digital Inc. have showcased contrasting revenue trajectories.
IBM, a stalwart in the tech industry, has experienced a gradual revenue decline from 2014 to 2024. Starting at a peak of approximately $92.8 billion in 2014, IBM's revenue has decreased by about 32% to $62.8 billion in 2024. This trend reflects the company's ongoing transformation and adaptation to new market demands.
Conversely, Gen Digital Inc. has seen a more volatile revenue pattern. From a high of $6.7 billion in 2014, the company faced a significant dip, reaching a low of $2.5 billion in 2020. However, recent years have shown a recovery, with revenues climbing back to $3.8 billion in 2024, marking a 52% increase from its lowest point.
These insights highlight the dynamic nature of the tech industry, where adaptability and innovation are crucial for sustained growth.
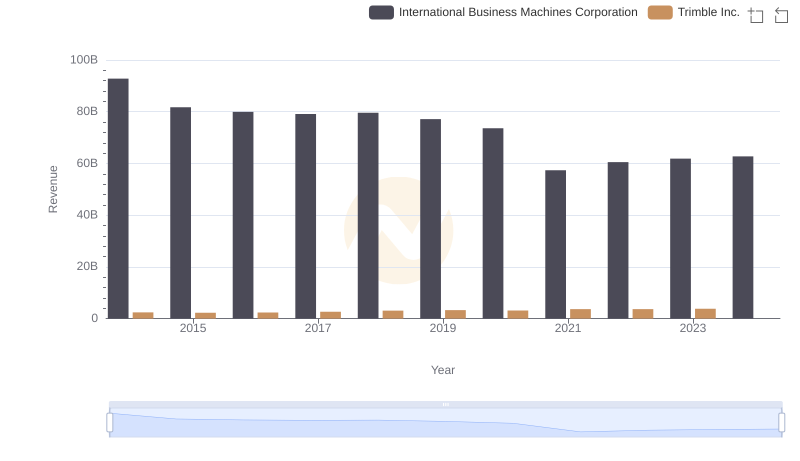
International Business Machines Corporation or Trimble Inc.: Who Leads in Yearly Revenue?
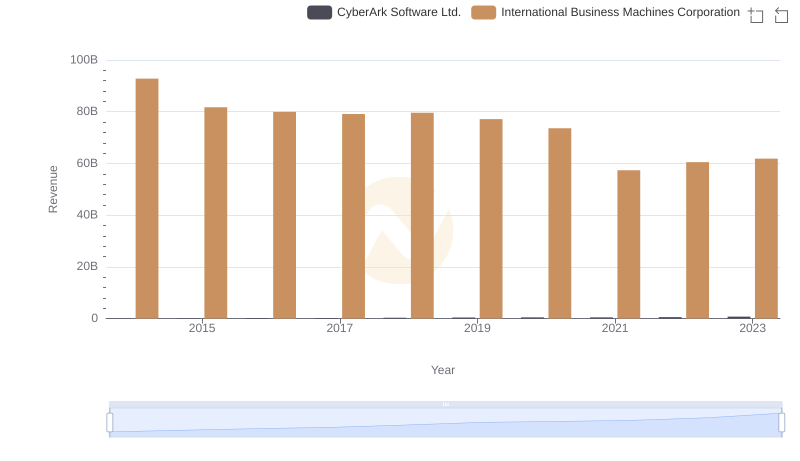
International Business Machines Corporation or CyberArk Software Ltd.: Who Leads in Yearly Revenue?
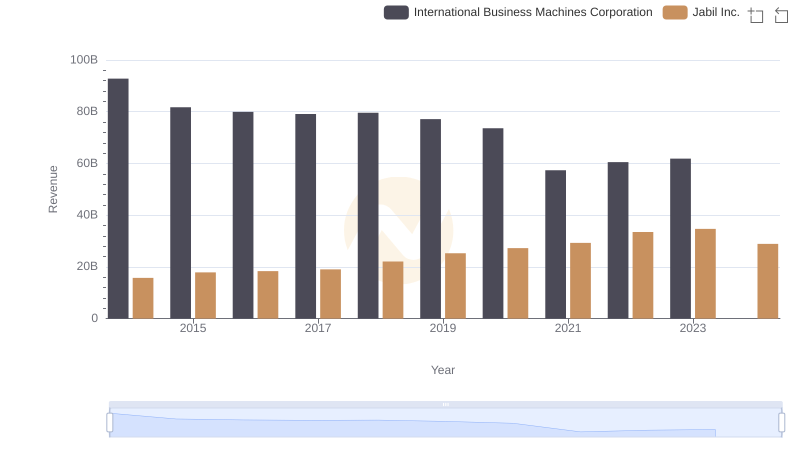
International Business Machines Corporation vs Jabil Inc.: Examining Key Revenue Metrics
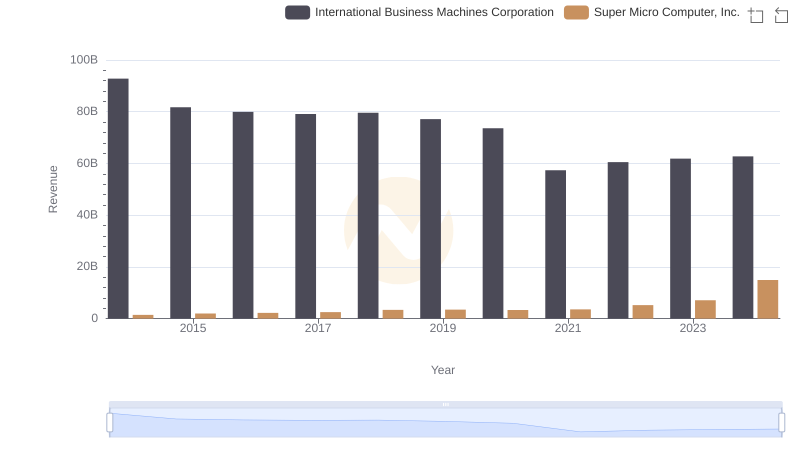
International Business Machines Corporation or Super Micro Computer, Inc.: Who Leads in Yearly Revenue?
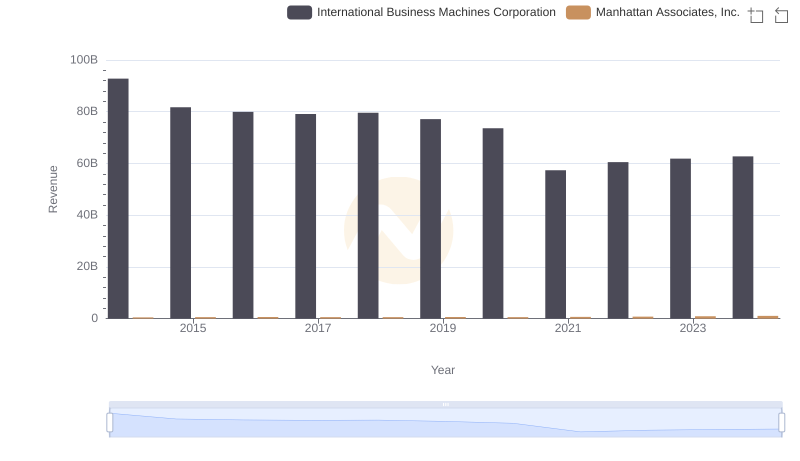
International Business Machines Corporation vs Manhattan Associates, Inc.: Annual Revenue Growth Compared
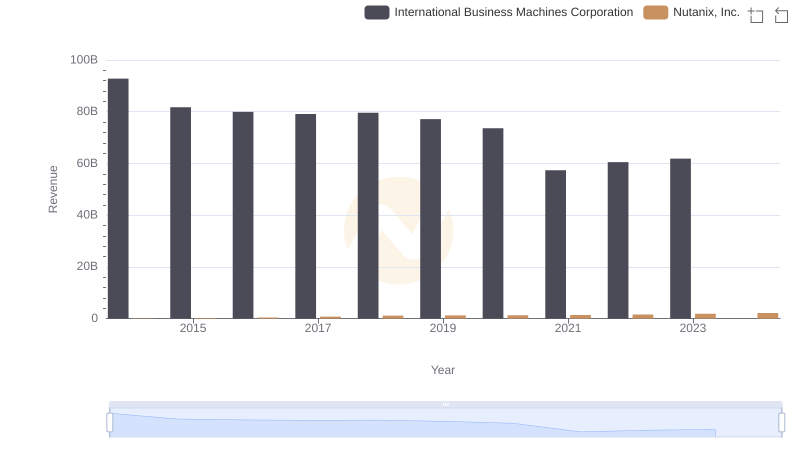
Comparing Revenue Performance: International Business Machines Corporation or Nutanix, Inc.?
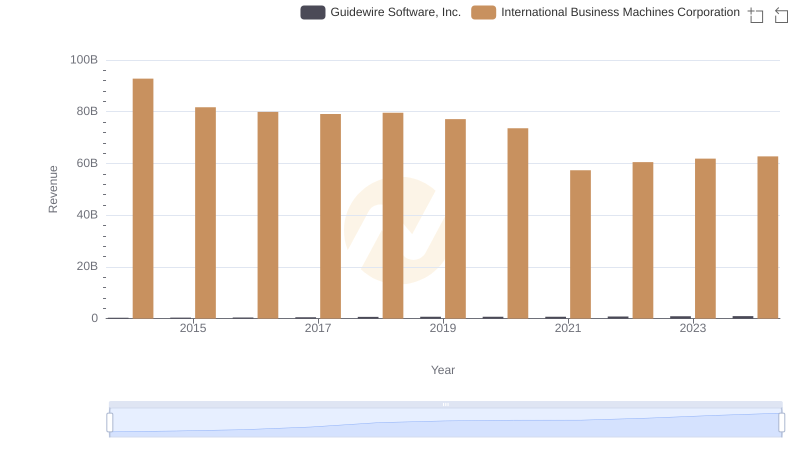
International Business Machines Corporation or Guidewire Software, Inc.: Who Leads in Yearly Revenue?
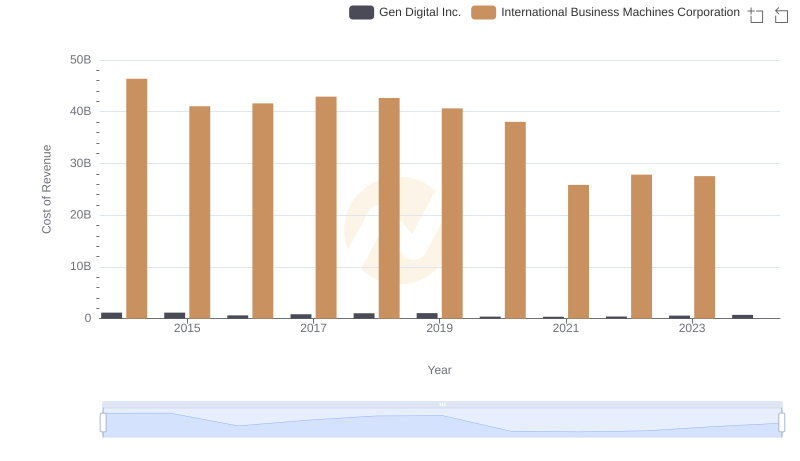
Cost of Revenue Trends: International Business Machines Corporation vs Gen Digital Inc.
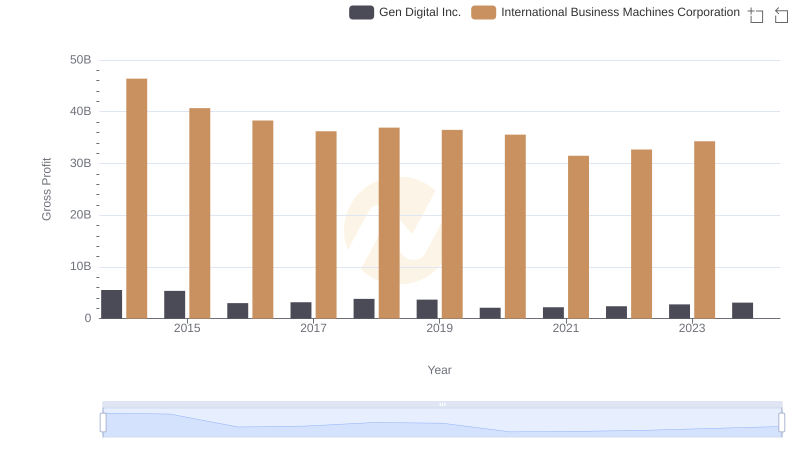
Gross Profit Analysis: Comparing International Business Machines Corporation and Gen Digital Inc.
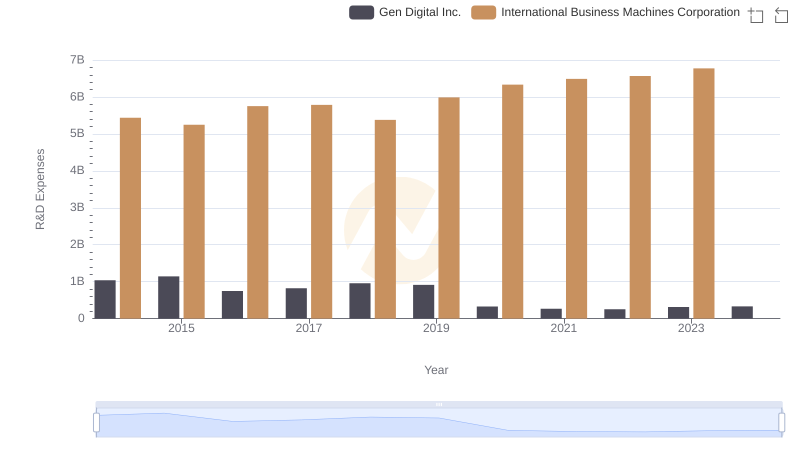
International Business Machines Corporation or Gen Digital Inc.: Who Invests More in Innovation?
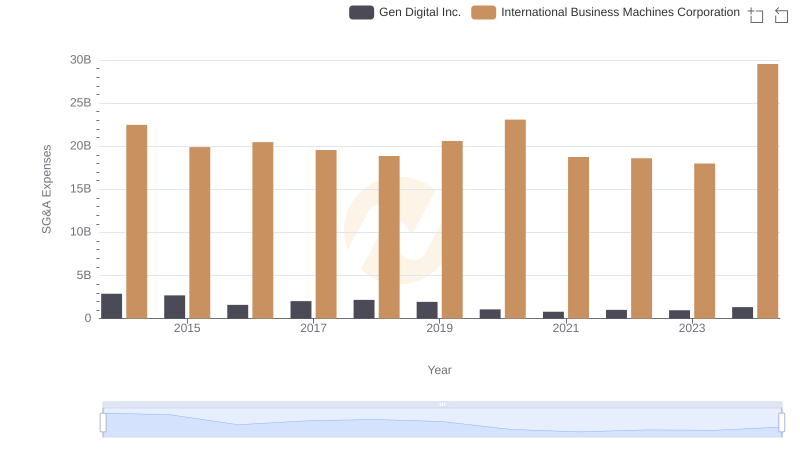
Selling, General, and Administrative Costs: International Business Machines Corporation vs Gen Digital Inc.
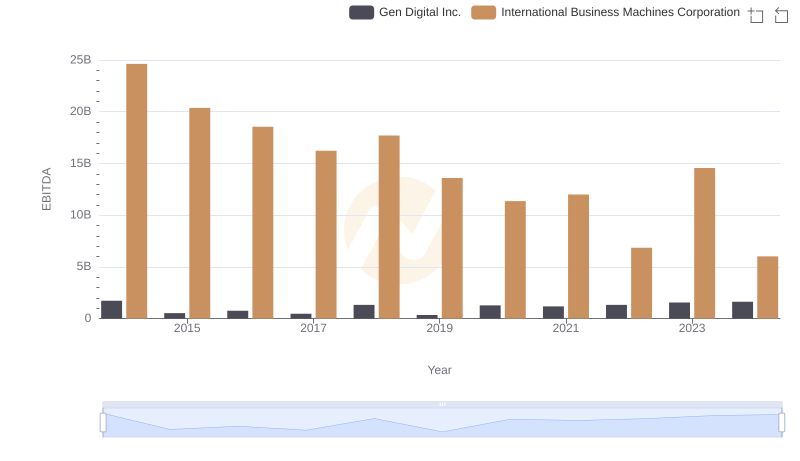
Comprehensive EBITDA Comparison: International Business Machines Corporation vs Gen Digital Inc.