| __timestamp | Global Payments Inc. | J.B. Hunt Transport Services, Inc. |
|---|---|---|
| Wednesday, January 1, 2014 | 1751611000 | 1041346000 |
| Thursday, January 1, 2015 | 1750511000 | 1146174000 |
| Friday, January 1, 2016 | 1767444000 | 1185633000 |
| Sunday, January 1, 2017 | 2047126000 | 1199293000 |
| Monday, January 1, 2018 | 2271352000 | 1359217000 |
| Tuesday, January 1, 2019 | 2838089000 | 1506255000 |
| Wednesday, January 1, 2020 | 3772831000 | 1449876000 |
| Friday, January 1, 2021 | 4750037000 | 1869819000 |
| Saturday, January 1, 2022 | 5196898000 | 2472527000 |
| Sunday, January 1, 2023 | 5926898000 | 2396388000 |
| Monday, January 1, 2024 | 6345778000 |
In pursuit of knowledge
In the ever-evolving landscape of global commerce, understanding the financial health of industry leaders is crucial. Over the past decade, Global Payments Inc. and J.B. Hunt Transport Services, Inc. have demonstrated remarkable growth in gross profit, reflecting their strategic prowess and market adaptability.
From 2014 to 2023, Global Payments Inc. saw its gross profit soar by approximately 238%, starting at $1.75 billion and reaching nearly $5.93 billion. This impressive growth underscores the company's robust expansion and innovation in payment solutions. Meanwhile, J.B. Hunt Transport Services, Inc. experienced a steady increase of around 130%, with gross profit rising from $1.04 billion to $2.40 billion, highlighting its resilience and efficiency in the transportation sector.
These figures not only showcase the companies' financial trajectories but also offer insights into broader industry trends, making them essential for investors and analysts alike.
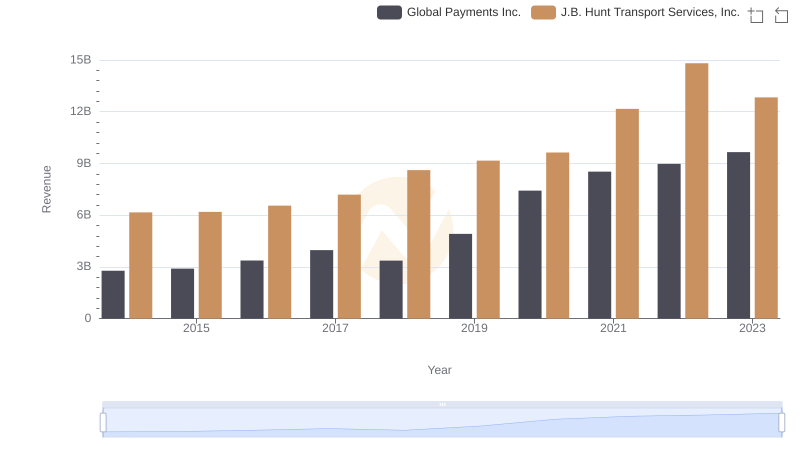
Global Payments Inc. or J.B. Hunt Transport Services, Inc.: Who Leads in Yearly Revenue?
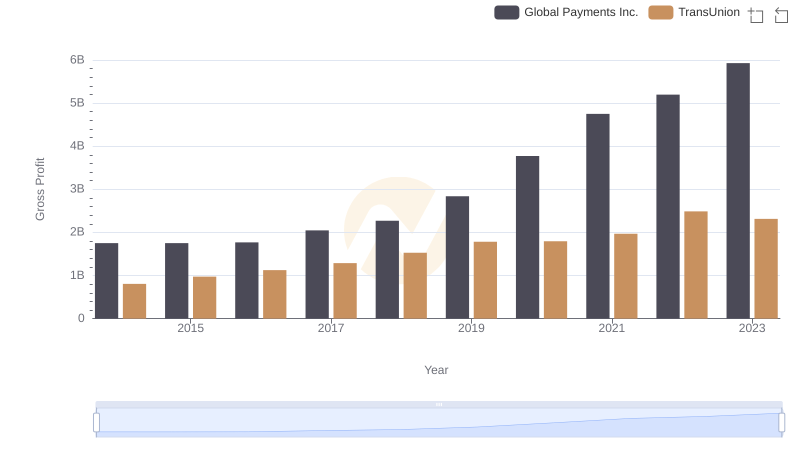
Global Payments Inc. and TransUnion: A Detailed Gross Profit Analysis
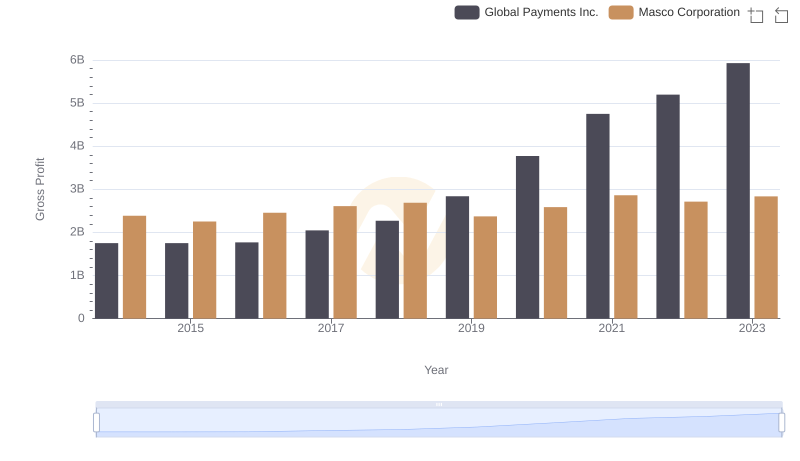
Gross Profit Comparison: Global Payments Inc. and Masco Corporation Trends
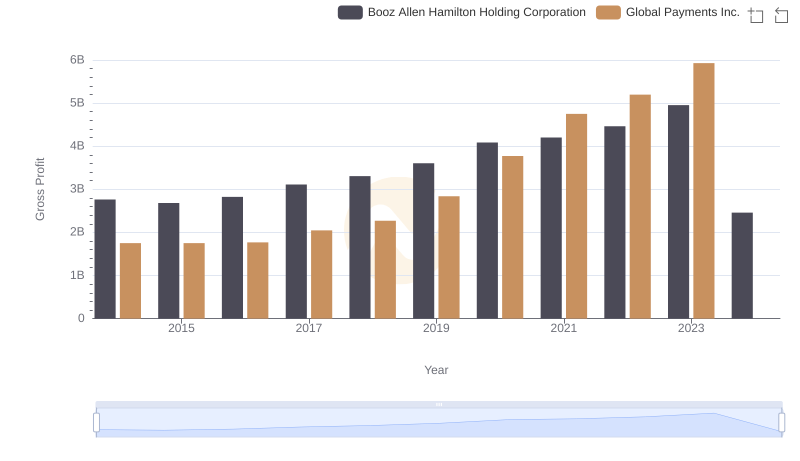
Gross Profit Analysis: Comparing Global Payments Inc. and Booz Allen Hamilton Holding Corporation
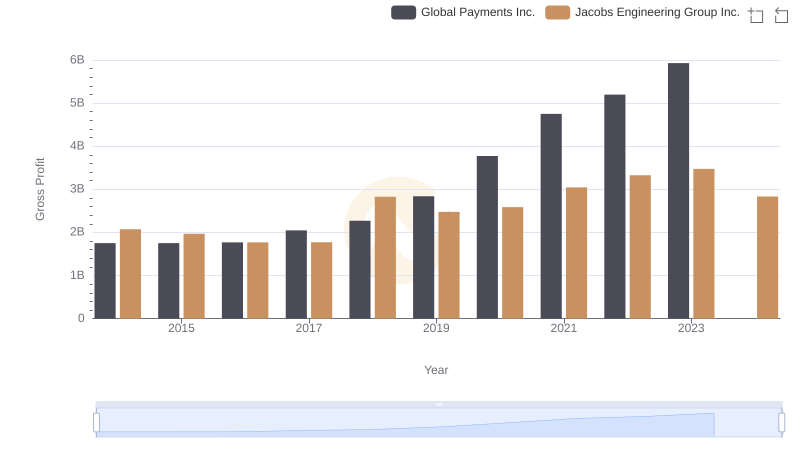
Global Payments Inc. vs Jacobs Engineering Group Inc.: A Gross Profit Performance Breakdown

Global Payments Inc. vs J.B. Hunt Transport Services, Inc.: SG&A Expense Trends
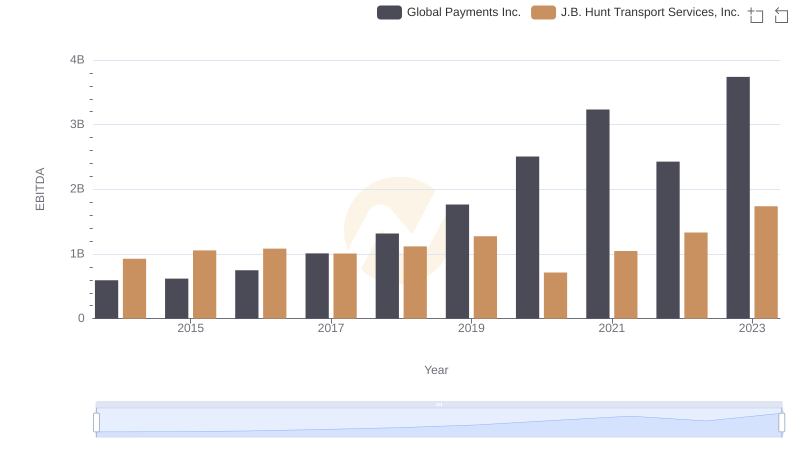
Comprehensive EBITDA Comparison: Global Payments Inc. vs J.B. Hunt Transport Services, Inc.