| __timestamp | Global Payments Inc. | J.B. Hunt Transport Services, Inc. |
|---|---|---|
| Wednesday, January 1, 2014 | 1295014000 | 152469000 |
| Thursday, January 1, 2015 | 1325567000 | 166799000 |
| Friday, January 1, 2016 | 1411096000 | 185436000 |
| Sunday, January 1, 2017 | 1488258000 | 273440000 |
| Monday, January 1, 2018 | 1534297000 | 323587000 |
| Tuesday, January 1, 2019 | 2046672000 | 383981000 |
| Wednesday, January 1, 2020 | 2878878000 | 348076000 |
| Friday, January 1, 2021 | 3391161000 | 395533000 |
| Saturday, January 1, 2022 | 3524578000 | 570191000 |
| Sunday, January 1, 2023 | 4073768000 | 590242000 |
| Monday, January 1, 2024 | 4285307000 |
Infusing magic into the data realm
In the ever-evolving landscape of corporate finance, the Selling, General, and Administrative (SG&A) expenses serve as a critical indicator of a company's operational efficiency. Over the past decade, Global Payments Inc. and J.B. Hunt Transport Services, Inc. have showcased contrasting trends in their SG&A expenses, reflecting their unique industry challenges and growth strategies.
From 2014 to 2023, Global Payments Inc. experienced a staggering 214% increase in SG&A expenses, highlighting its aggressive expansion and investment in technology. In contrast, J.B. Hunt Transport Services, Inc. saw a more modest 287% rise, indicative of its steady growth in the logistics sector. Notably, 2023 marked a peak for both companies, with Global Payments Inc. reaching approximately $4.1 billion and J.B. Hunt Transport Services, Inc. nearing $590 million in SG&A expenses.
These trends underscore the dynamic nature of financial management across different industries, offering valuable insights for investors and analysts alike.
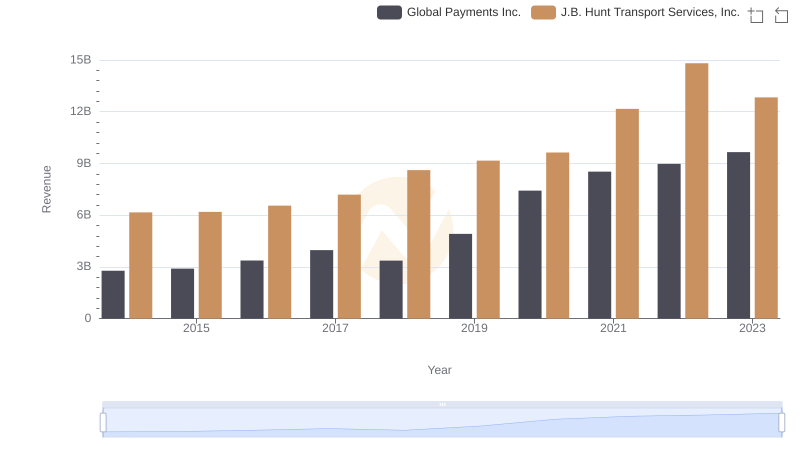
Global Payments Inc. or J.B. Hunt Transport Services, Inc.: Who Leads in Yearly Revenue?
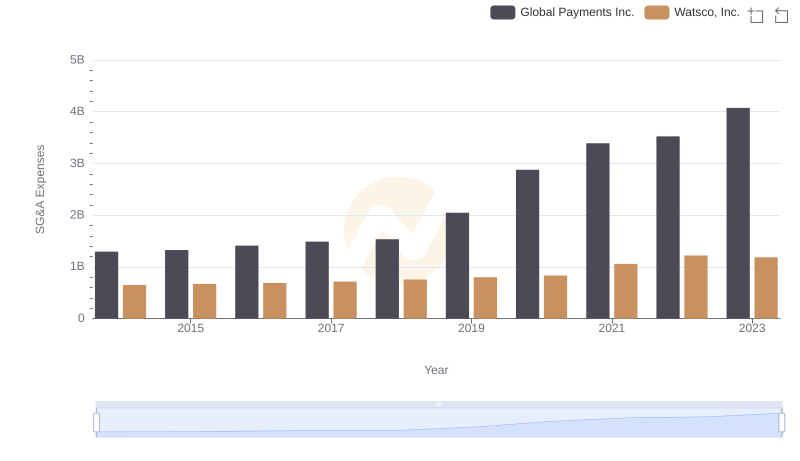
Global Payments Inc. vs Watsco, Inc.: SG&A Expense Trends
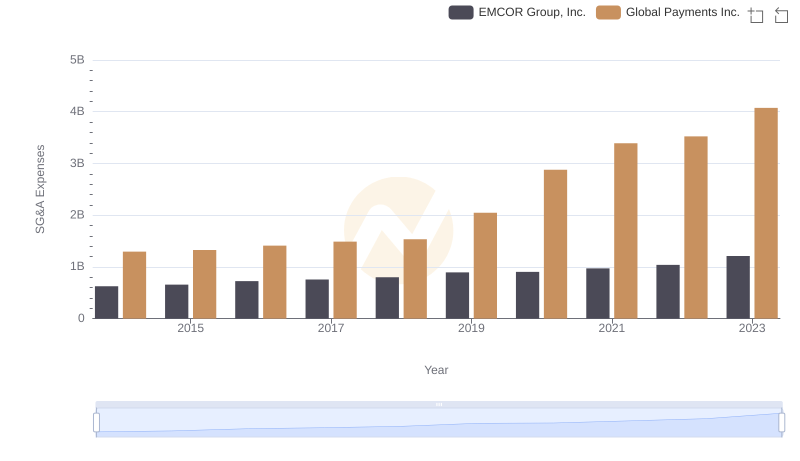
Comparing SG&A Expenses: Global Payments Inc. vs EMCOR Group, Inc. Trends and Insights
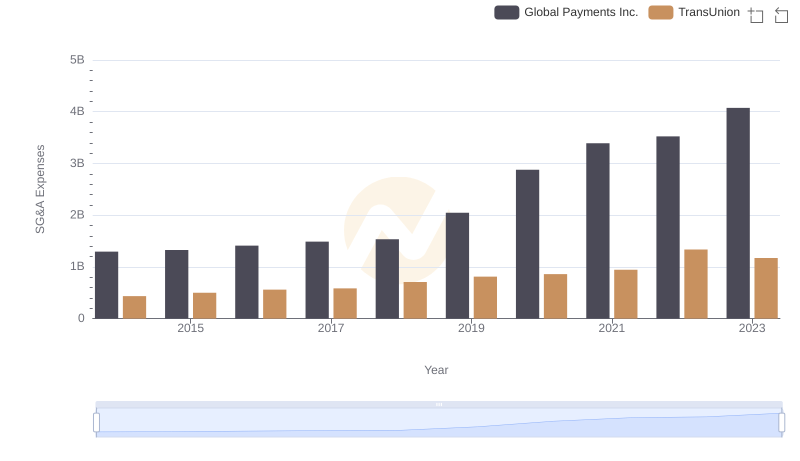
Selling, General, and Administrative Costs: Global Payments Inc. vs TransUnion
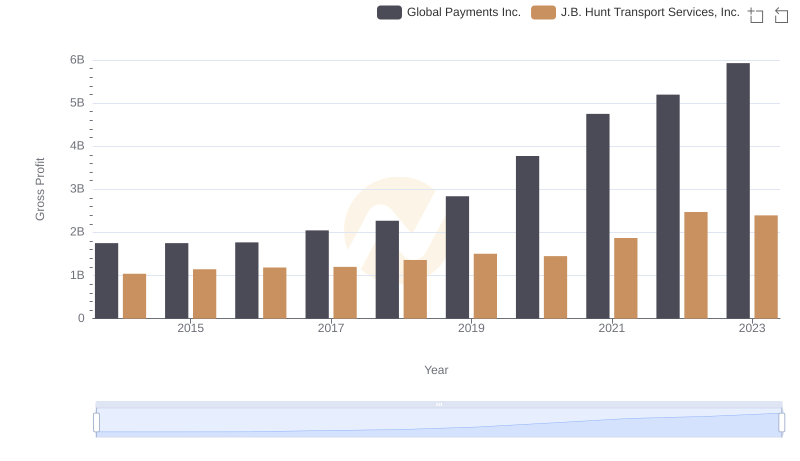
Global Payments Inc. vs J.B. Hunt Transport Services, Inc.: A Gross Profit Performance Breakdown
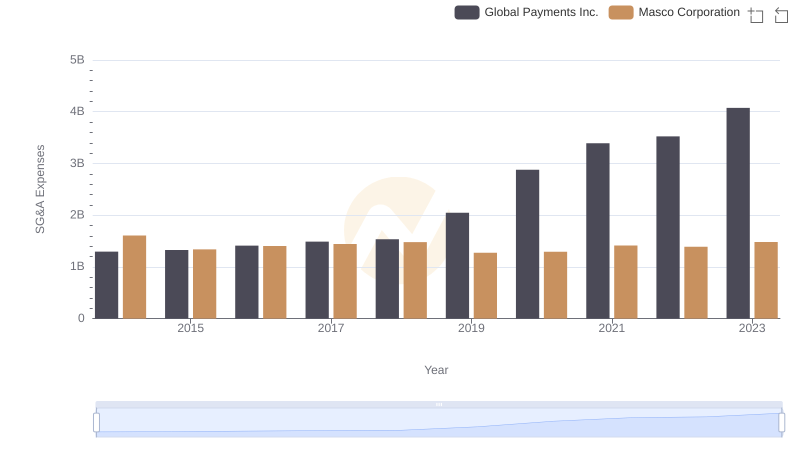
Breaking Down SG&A Expenses: Global Payments Inc. vs Masco Corporation
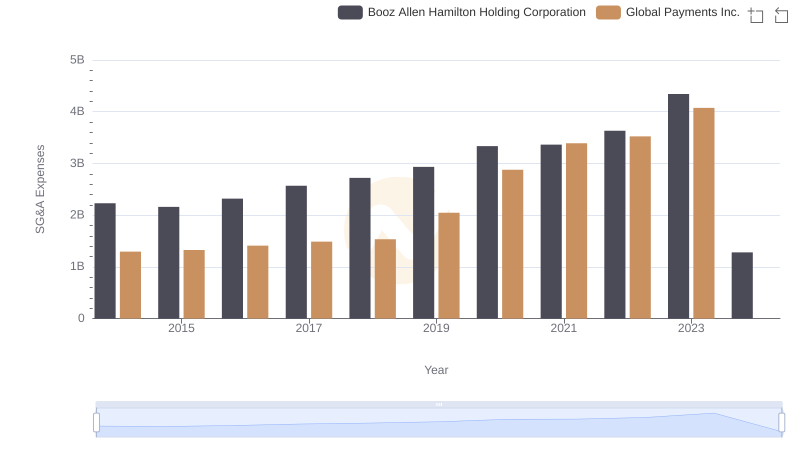
Who Optimizes SG&A Costs Better? Global Payments Inc. or Booz Allen Hamilton Holding Corporation
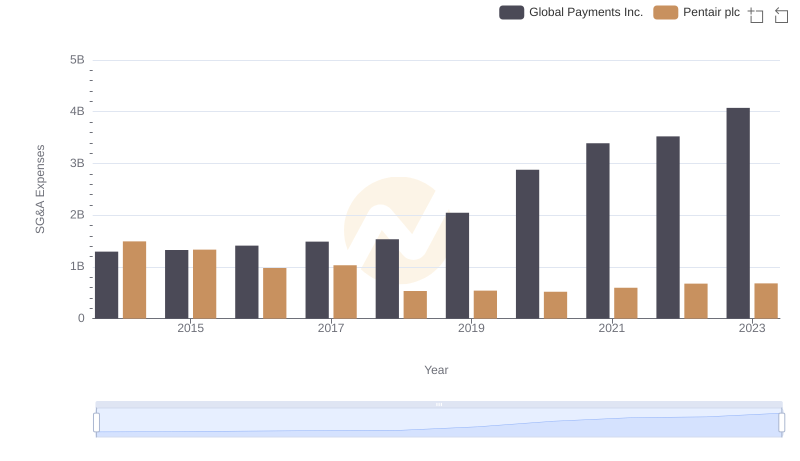
Selling, General, and Administrative Costs: Global Payments Inc. vs Pentair plc
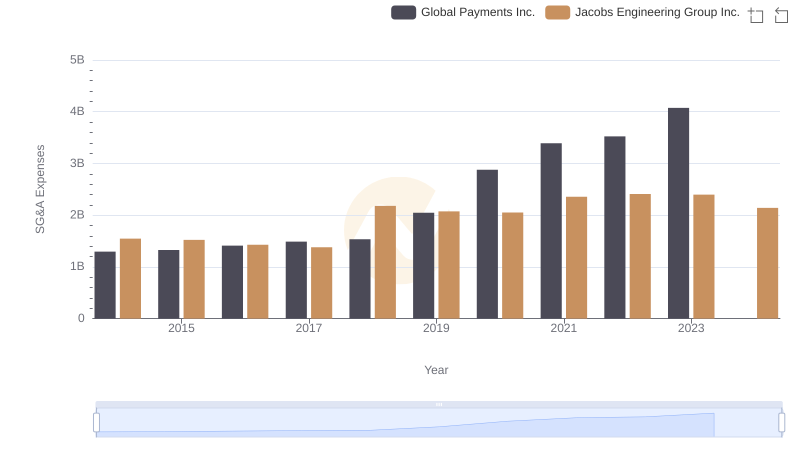
Cost Management Insights: SG&A Expenses for Global Payments Inc. and Jacobs Engineering Group Inc.
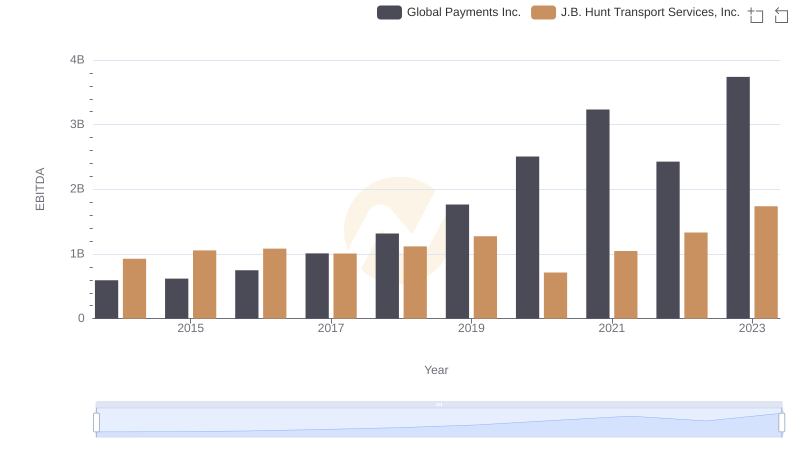
Comprehensive EBITDA Comparison: Global Payments Inc. vs J.B. Hunt Transport Services, Inc.