| __timestamp | Axon Enterprise, Inc. | United Rentals, Inc. |
|---|---|---|
| Wednesday, January 1, 2014 | 101548000 | 2432000000 |
| Thursday, January 1, 2015 | 128647000 | 2480000000 |
| Friday, January 1, 2016 | 170536000 | 2403000000 |
| Sunday, January 1, 2017 | 207088000 | 2769000000 |
| Monday, January 1, 2018 | 258583000 | 3364000000 |
| Tuesday, January 1, 2019 | 307286000 | 3670000000 |
| Wednesday, January 1, 2020 | 416331000 | 3183000000 |
| Friday, January 1, 2021 | 540910000 | 3853000000 |
| Saturday, January 1, 2022 | 728638000 | 4996000000 |
| Sunday, January 1, 2023 | 955382000 | 5813000000 |
| Monday, January 1, 2024 | 6150000000 |
Data in motion
In the competitive landscape of industrial and technology sectors, United Rentals, Inc. and Axon Enterprise, Inc. have showcased remarkable growth in gross profit over the past decade. Since 2014, United Rentals has consistently outperformed Axon, with its gross profit soaring by approximately 150% by 2023. Meanwhile, Axon has demonstrated impressive growth, increasing its gross profit by nearly 840% over the same period.
United Rentals, a leader in equipment rental, has seen its gross profit rise from $2.4 billion in 2014 to an impressive $5.8 billion in 2023. On the other hand, Axon, known for its innovative public safety technologies, has grown from $101 million to $955 million. This data highlights the dynamic nature of these industries and the strategic maneuvers that have propelled these companies to new heights.
The data for 2024 is incomplete, indicating a potential area for further analysis and insight.
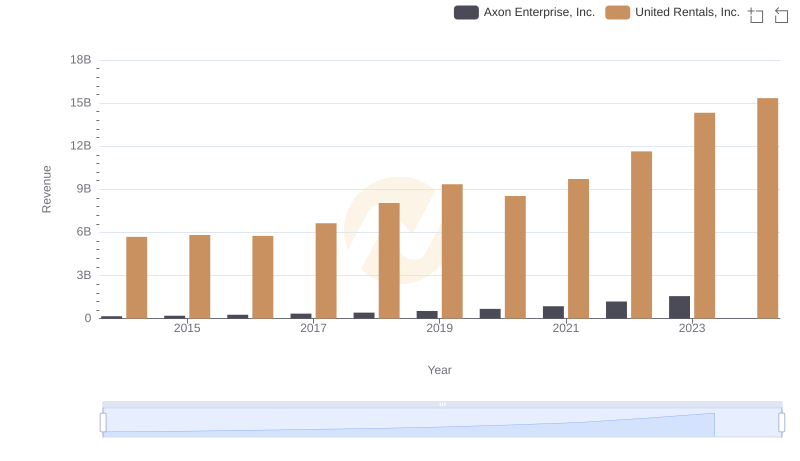
Breaking Down Revenue Trends: United Rentals, Inc. vs Axon Enterprise, Inc.
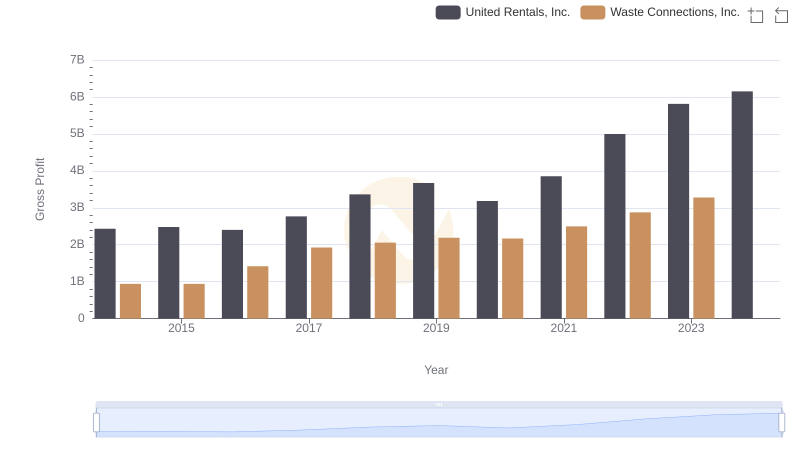
Gross Profit Trends Compared: United Rentals, Inc. vs Waste Connections, Inc.
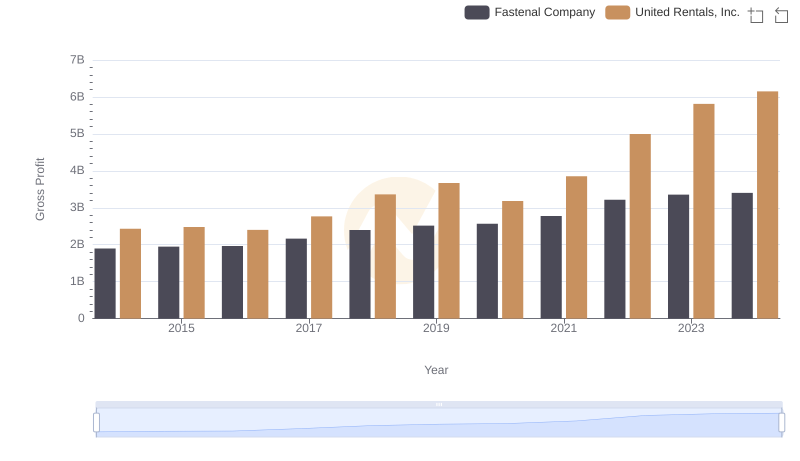
Gross Profit Comparison: United Rentals, Inc. and Fastenal Company Trends
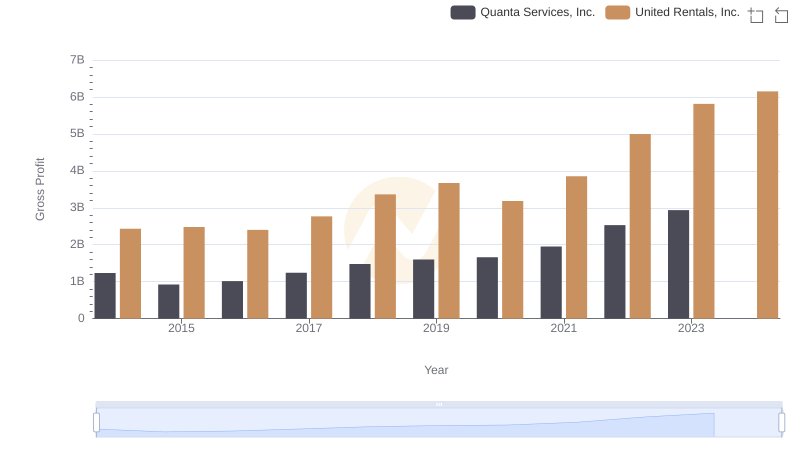
Gross Profit Comparison: United Rentals, Inc. and Quanta Services, Inc. Trends
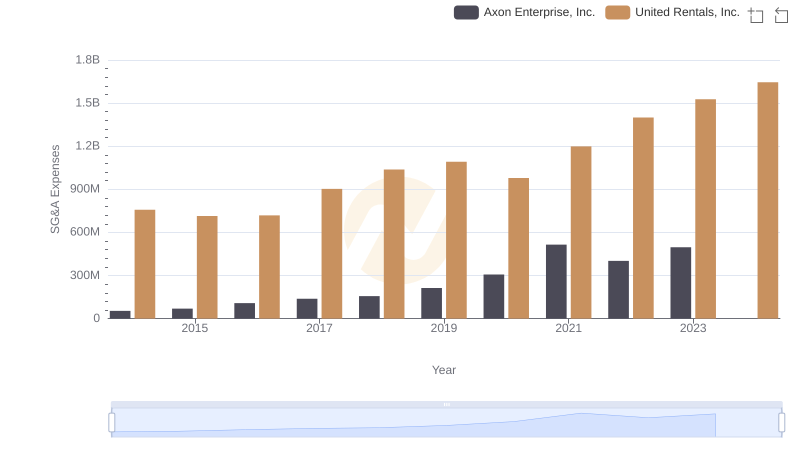
Comparing SG&A Expenses: United Rentals, Inc. vs Axon Enterprise, Inc. Trends and Insights
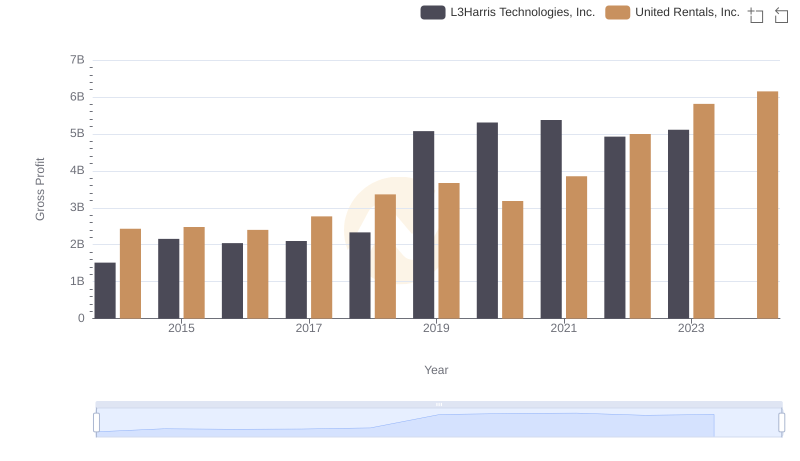
United Rentals, Inc. vs L3Harris Technologies, Inc.: A Gross Profit Performance Breakdown
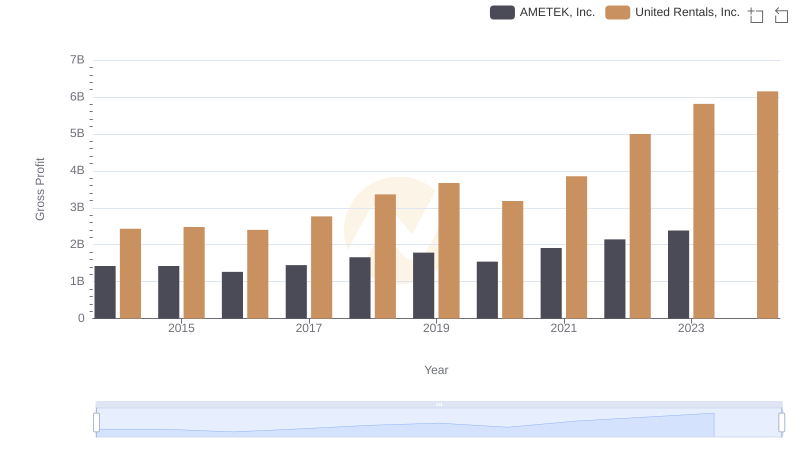
Gross Profit Analysis: Comparing United Rentals, Inc. and AMETEK, Inc.
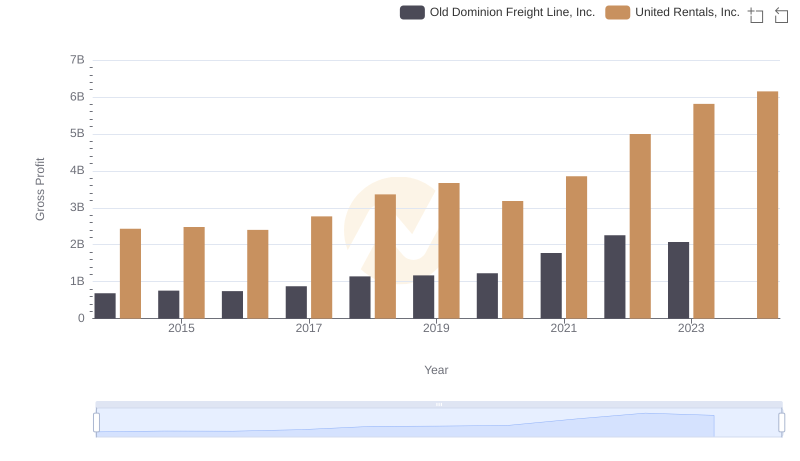
Gross Profit Comparison: United Rentals, Inc. and Old Dominion Freight Line, Inc. Trends
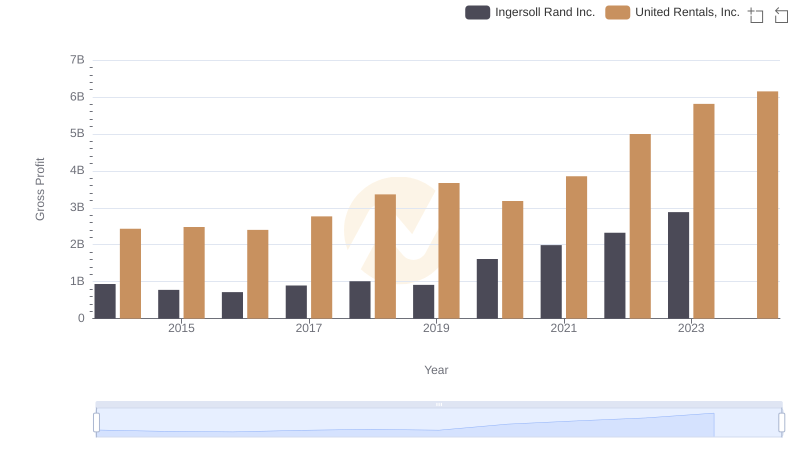
United Rentals, Inc. and Ingersoll Rand Inc.: A Detailed Gross Profit Analysis
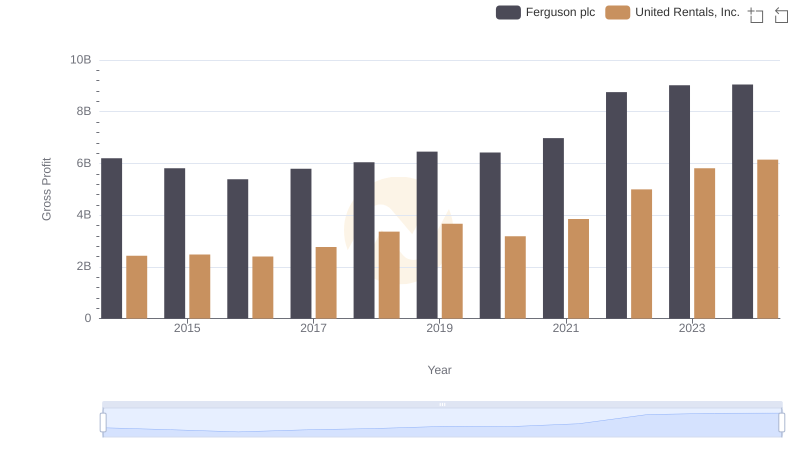
Key Insights on Gross Profit: United Rentals, Inc. vs Ferguson plc