| __timestamp | International Business Machines Corporation | VeriSign, Inc. |
|---|---|---|
| Wednesday, January 1, 2014 | 22472000000 | 189488000 |
| Thursday, January 1, 2015 | 19894000000 | 196914000 |
| Friday, January 1, 2016 | 20279000000 | 198253000 |
| Sunday, January 1, 2017 | 19680000000 | 211705000 |
| Monday, January 1, 2018 | 19366000000 | 197559000 |
| Tuesday, January 1, 2019 | 18724000000 | 184262000 |
| Wednesday, January 1, 2020 | 20561000000 | 186003000 |
| Friday, January 1, 2021 | 18745000000 | 188311000 |
| Saturday, January 1, 2022 | 17483000000 | 195400000 |
| Sunday, January 1, 2023 | 17997000000 | 204200000 |
| Monday, January 1, 2024 | 29536000000 | 211100000 |
Unleashing the power of data
In the ever-evolving landscape of technology, understanding a company's operational efficiency is crucial. This analysis delves into the Selling, General, and Administrative (SG&A) expenses of two industry titans: International Business Machines Corporation (IBM) and VeriSign, Inc., from 2014 to 2023.
IBM, a stalwart in the tech industry, has seen its SG&A expenses fluctuate, peaking in 2024 with a 42% increase from its lowest point in 2023. This suggests a strategic shift or investment in operational capabilities. In contrast, VeriSign, a leader in domain name registry services, maintains a more consistent SG&A expense pattern, with a modest 11% increase over the same period.
The data highlights IBM's dynamic approach to managing operational costs, while VeriSign's steady trajectory underscores its stable business model. Missing data for 2024 suggests further analysis is needed to understand future trends.
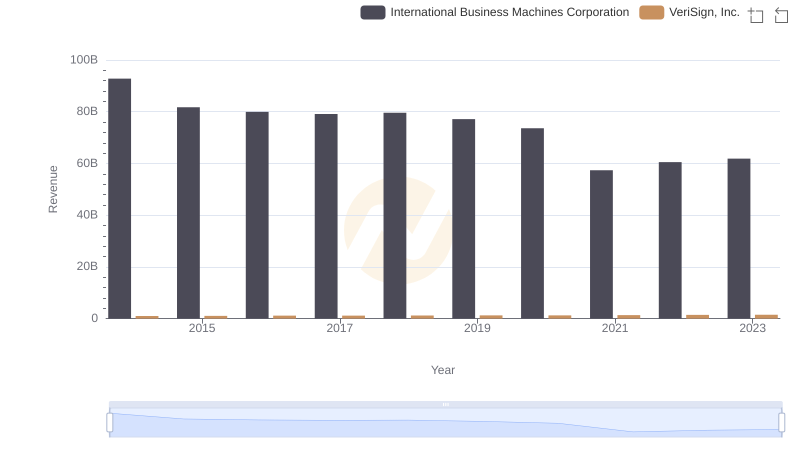
Who Generates More Revenue? International Business Machines Corporation or VeriSign, Inc.
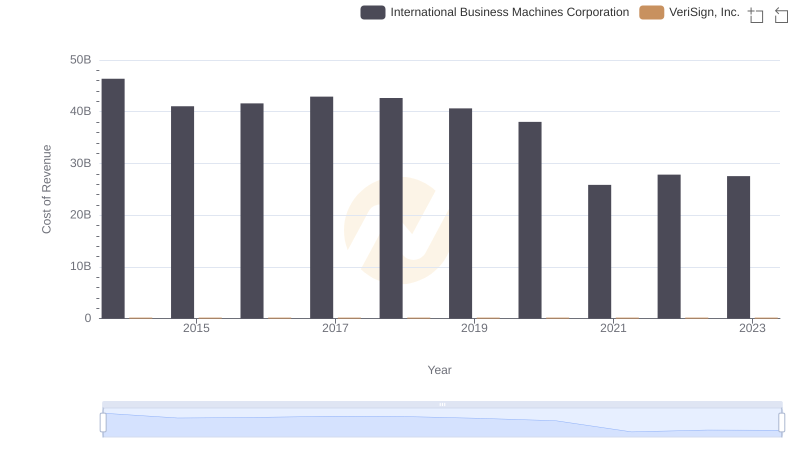
Cost of Revenue: Key Insights for International Business Machines Corporation and VeriSign, Inc.
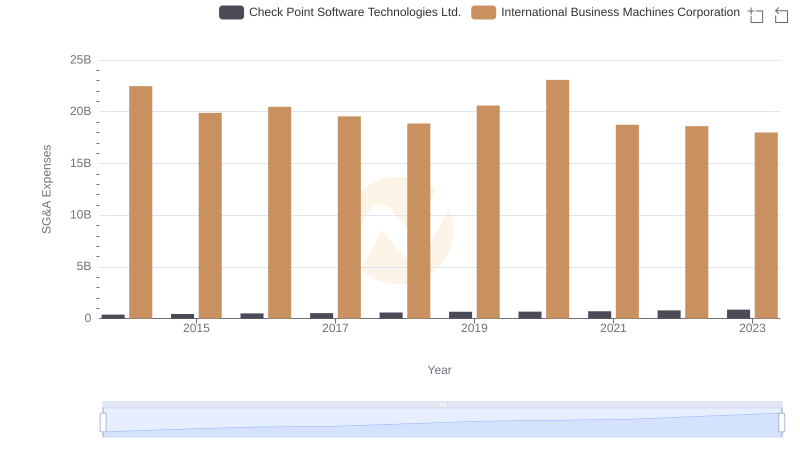
Operational Costs Compared: SG&A Analysis of International Business Machines Corporation and Check Point Software Technologies Ltd.
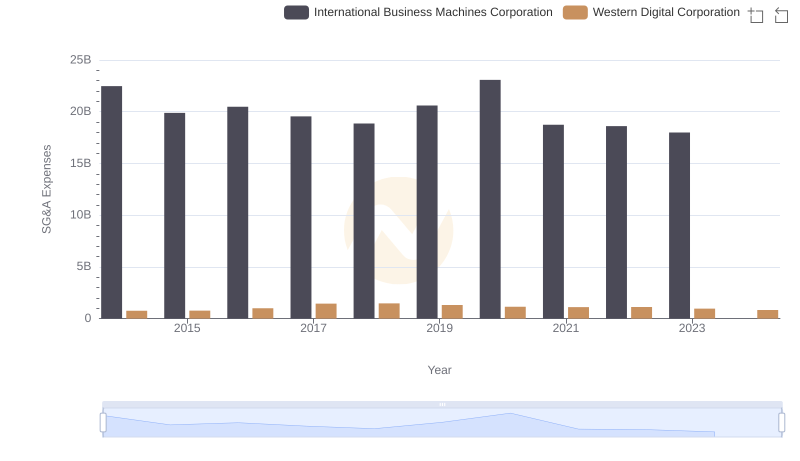
Selling, General, and Administrative Costs: International Business Machines Corporation vs Western Digital Corporation
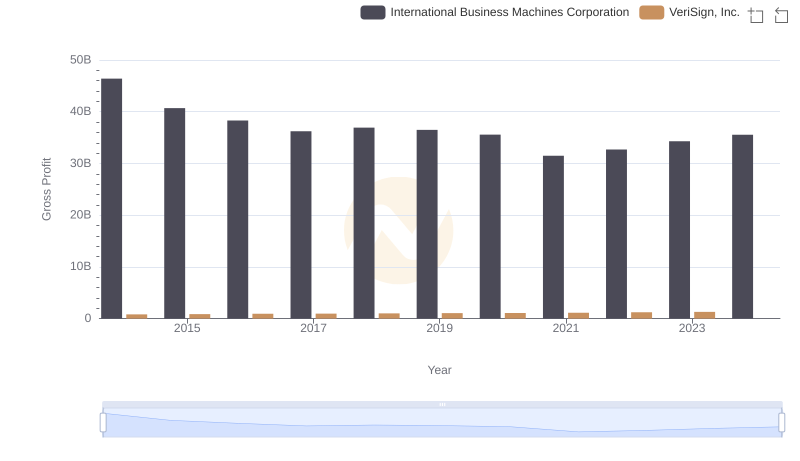
Gross Profit Analysis: Comparing International Business Machines Corporation and VeriSign, Inc.
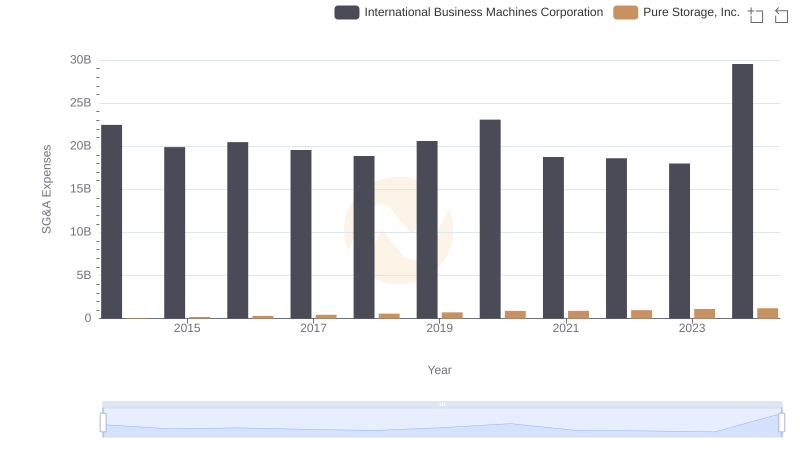
International Business Machines Corporation or Pure Storage, Inc.: Who Manages SG&A Costs Better?
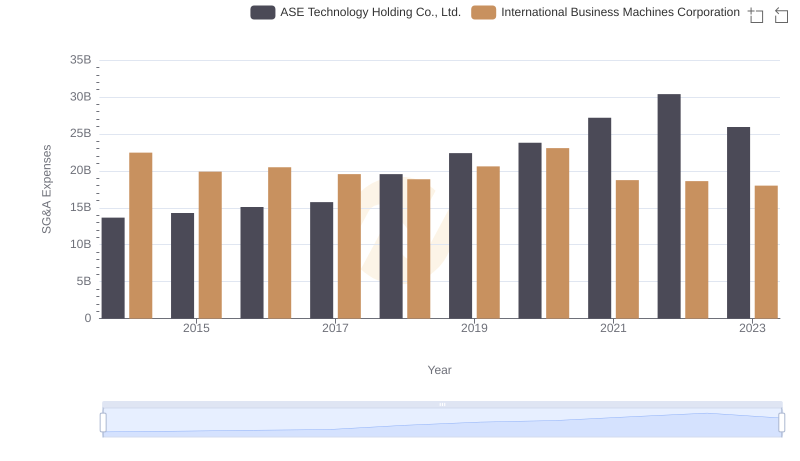
Comparing SG&A Expenses: International Business Machines Corporation vs ASE Technology Holding Co., Ltd. Trends and Insights
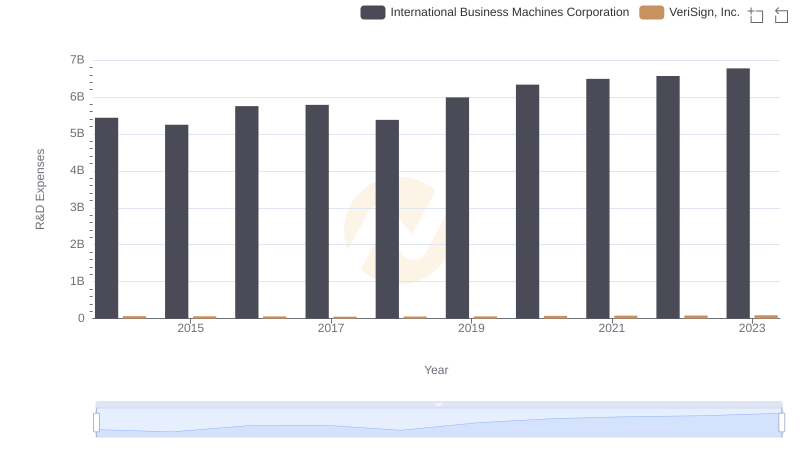
International Business Machines Corporation vs VeriSign, Inc.: Strategic Focus on R&D Spending
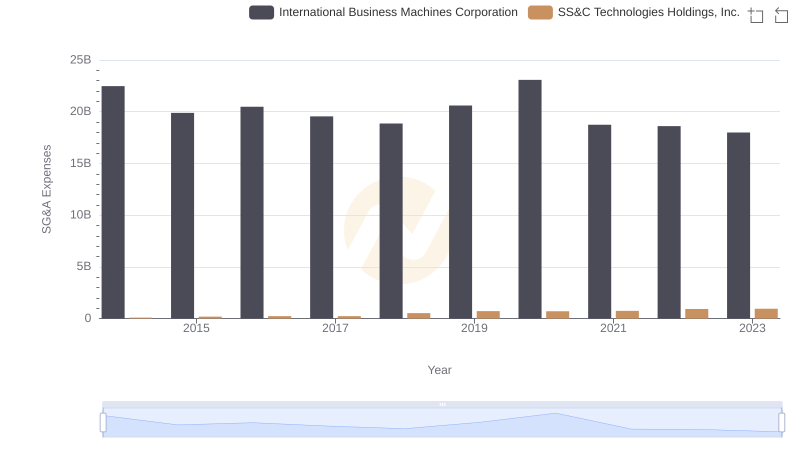
SG&A Efficiency Analysis: Comparing International Business Machines Corporation and SS&C Technologies Holdings, Inc.
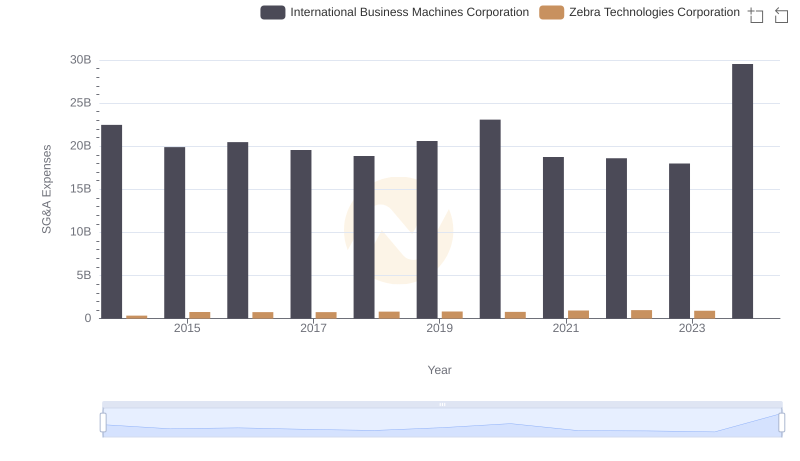
Who Optimizes SG&A Costs Better? International Business Machines Corporation or Zebra Technologies Corporation
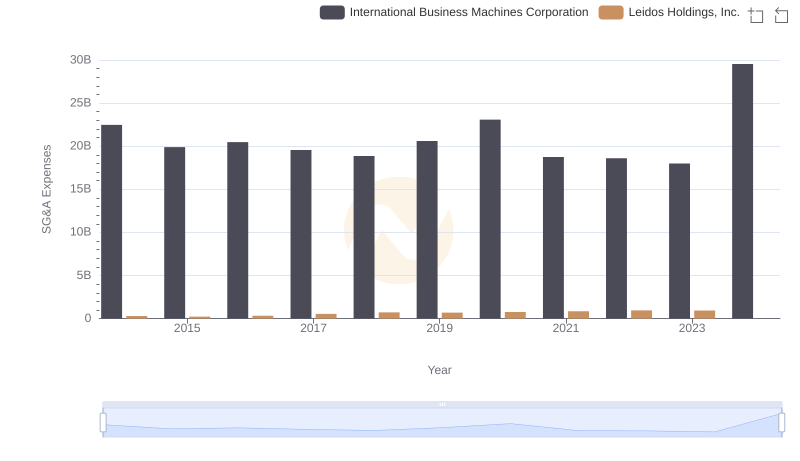
Who Optimizes SG&A Costs Better? International Business Machines Corporation or Leidos Holdings, Inc.
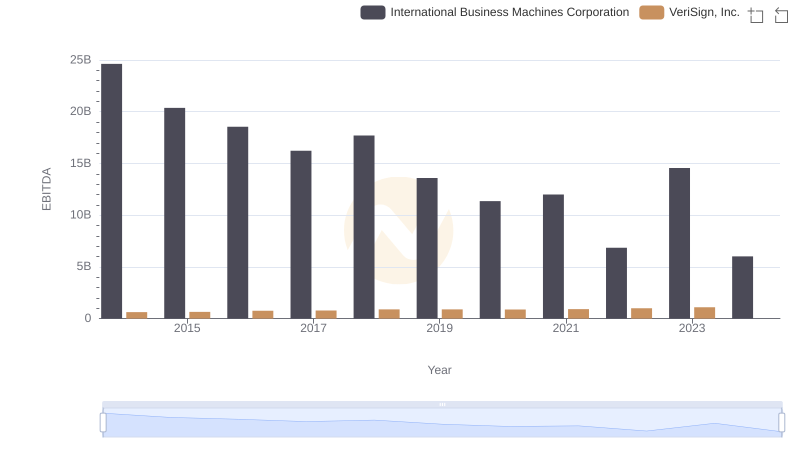
International Business Machines Corporation and VeriSign, Inc.: A Detailed Examination of EBITDA Performance