| __timestamp | Adobe Inc. | International Business Machines Corporation |
|---|---|---|
| Wednesday, January 1, 2014 | 2215140000 | 22472000000 |
| Thursday, January 1, 2015 | 2215161000 | 19894000000 |
| Friday, January 1, 2016 | 2487907000 | 20279000000 |
| Sunday, January 1, 2017 | 2822298000 | 19680000000 |
| Monday, January 1, 2018 | 3365727000 | 19366000000 |
| Tuesday, January 1, 2019 | 4124984000 | 18724000000 |
| Wednesday, January 1, 2020 | 4559000000 | 20561000000 |
| Friday, January 1, 2021 | 5406000000 | 18745000000 |
| Saturday, January 1, 2022 | 6187000000 | 17483000000 |
| Sunday, January 1, 2023 | 6764000000 | 17997000000 |
| Monday, January 1, 2024 | 7293000000 | 29536000000 |
Unleashing the power of data
In the ever-evolving landscape of technology, the financial strategies of industry leaders like Adobe Inc. and International Business Machines Corporation (IBM) offer a fascinating glimpse into their operational priorities. Over the past decade, from 2014 to 2024, Adobe's Selling, General, and Administrative (SG&A) expenses have surged by approximately 230%, reflecting its aggressive growth and expansion strategies. In contrast, IBM's SG&A expenses have shown a more fluctuating pattern, peaking in 2024 with a 30% increase from its 2014 figures.
This divergence highlights Adobe's focus on scaling its operations, while IBM's strategy appears more conservative, possibly reflecting its established market position. The data underscores the dynamic nature of the tech industry, where financial decisions are pivotal in shaping a company's trajectory. As we look to the future, these trends may offer insights into the evolving priorities of these tech titans.
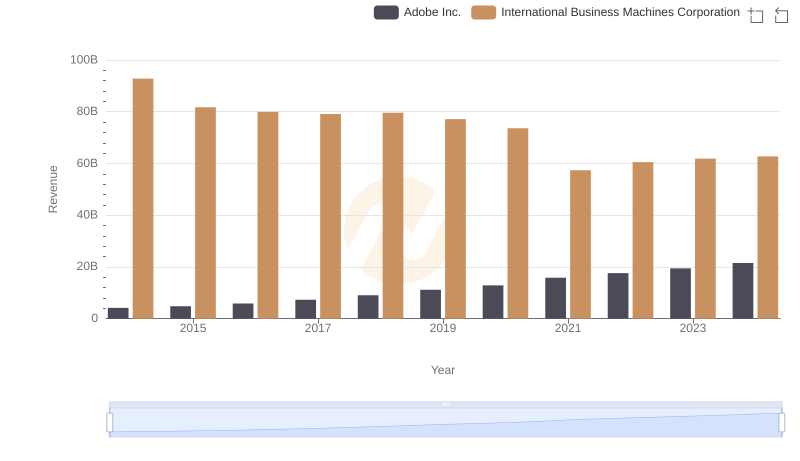
Who Generates More Revenue? International Business Machines Corporation or Adobe Inc.
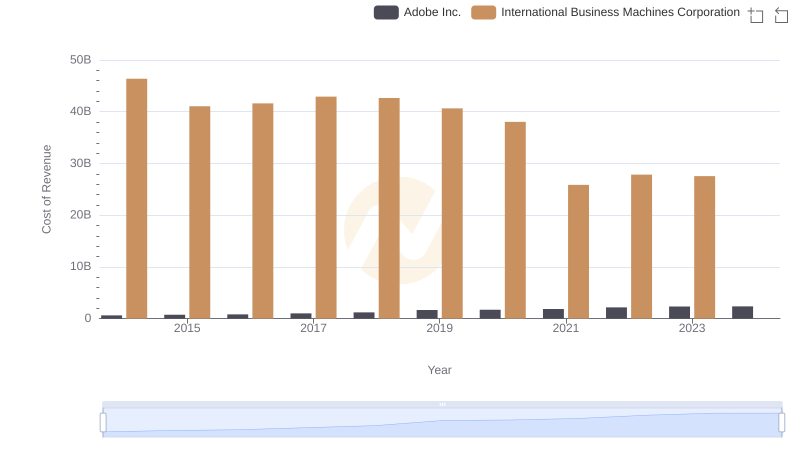
Cost of Revenue Trends: International Business Machines Corporation vs Adobe Inc.
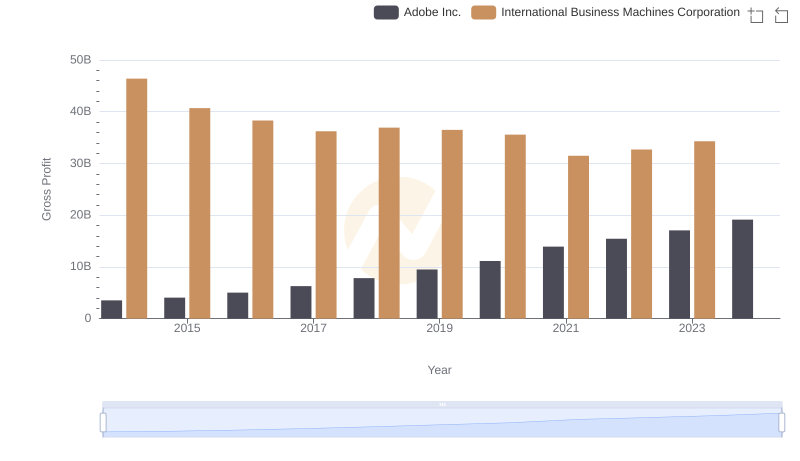
Gross Profit Trends Compared: International Business Machines Corporation vs Adobe Inc.
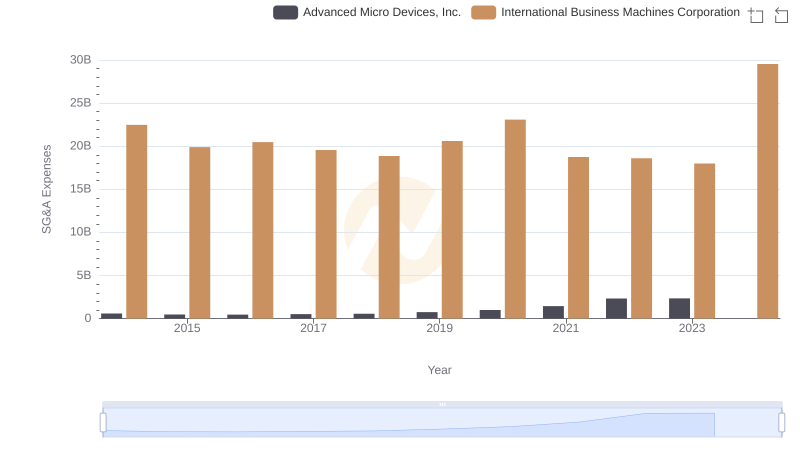
Operational Costs Compared: SG&A Analysis of International Business Machines Corporation and Advanced Micro Devices, Inc.
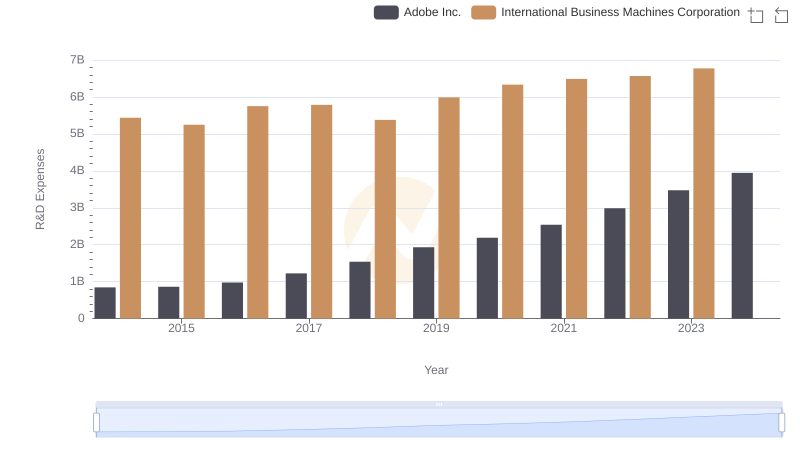
Analyzing R&D Budgets: International Business Machines Corporation vs Adobe Inc.
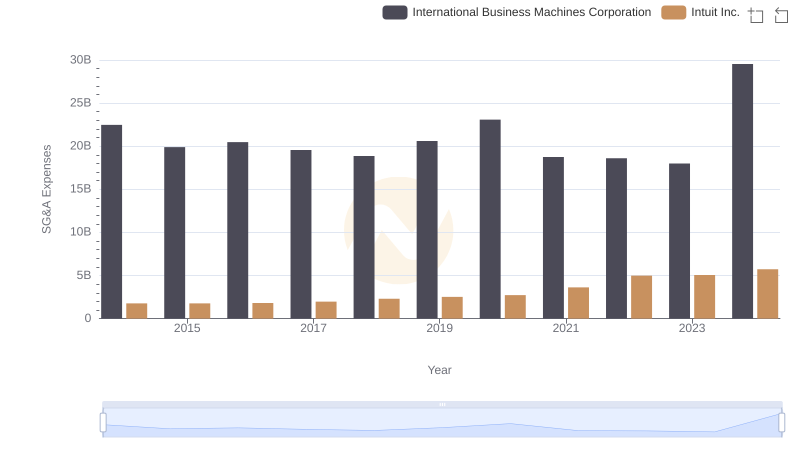
International Business Machines Corporation or Intuit Inc.: Who Manages SG&A Costs Better?
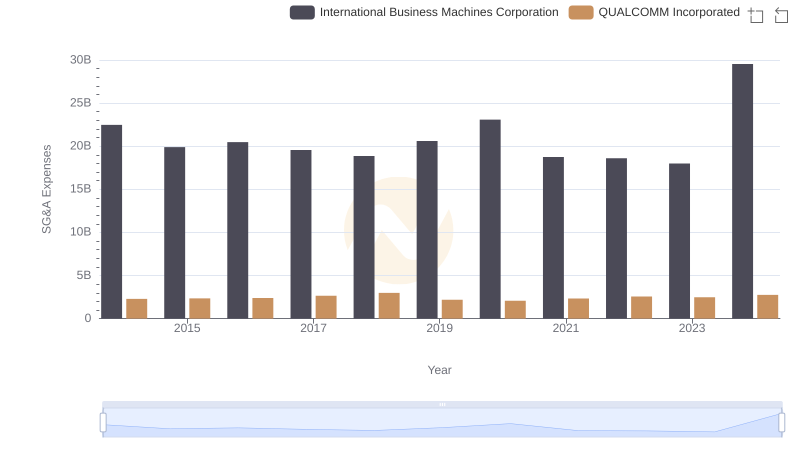
Breaking Down SG&A Expenses: International Business Machines Corporation vs QUALCOMM Incorporated
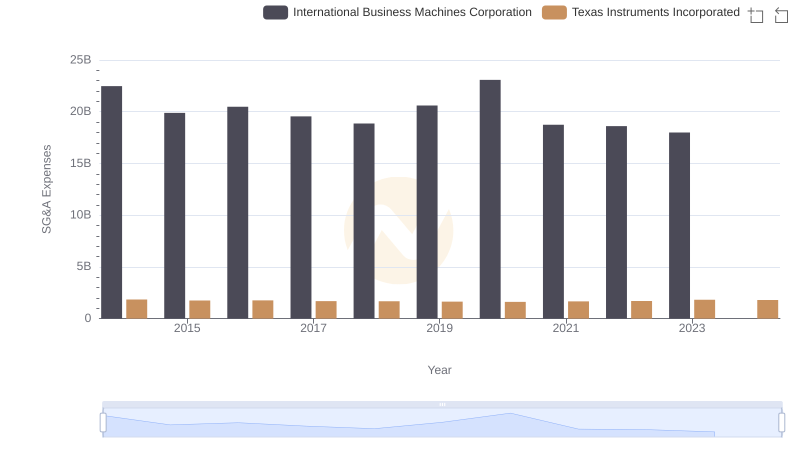
International Business Machines Corporation or Texas Instruments Incorporated: Who Manages SG&A Costs Better?
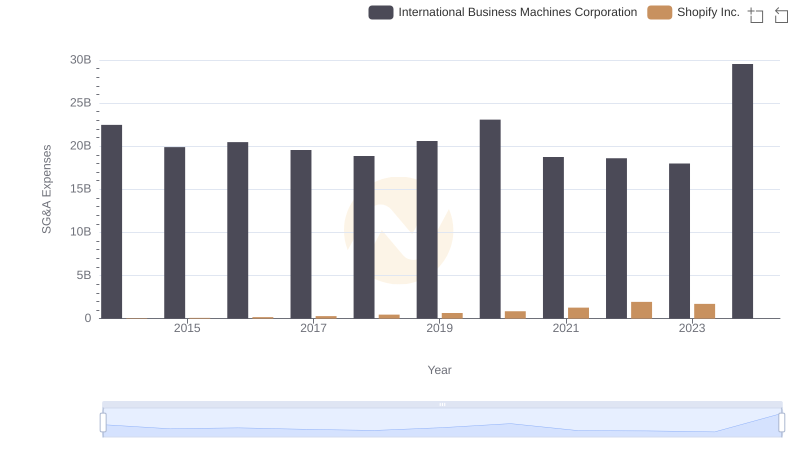
International Business Machines Corporation vs Shopify Inc.: SG&A Expense Trends
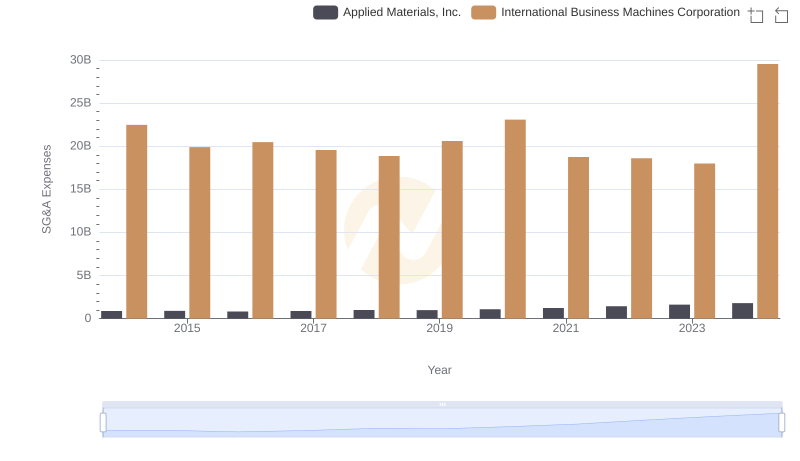
SG&A Efficiency Analysis: Comparing International Business Machines Corporation and Applied Materials, Inc.
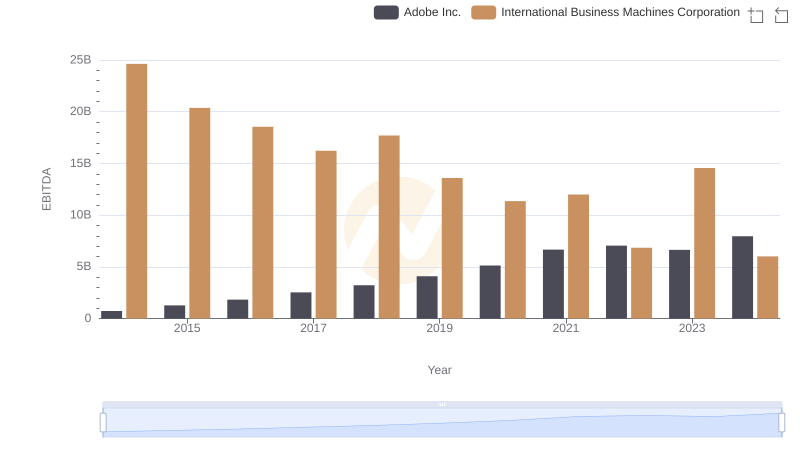
International Business Machines Corporation and Adobe Inc.: A Detailed Examination of EBITDA Performance
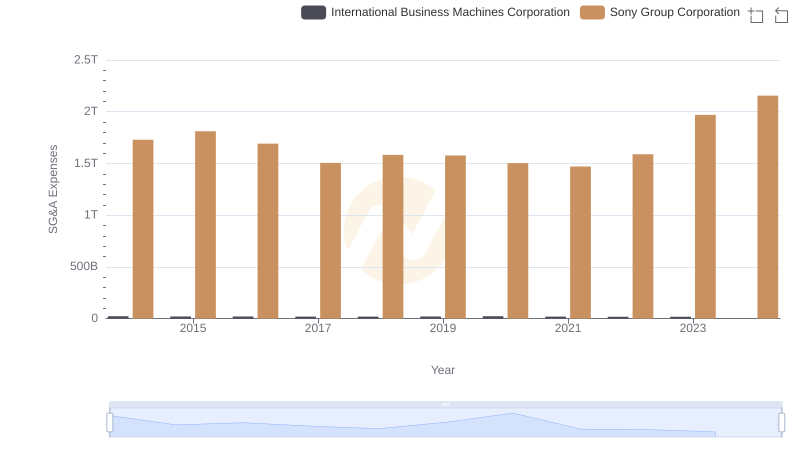
Who Optimizes SG&A Costs Better? International Business Machines Corporation or Sony Group Corporation