| __timestamp | International Business Machines Corporation | QUALCOMM Incorporated |
|---|---|---|
| Wednesday, January 1, 2014 | 22472000000 | 2290000000 |
| Thursday, January 1, 2015 | 19894000000 | 2344000000 |
| Friday, January 1, 2016 | 20279000000 | 2385000000 |
| Sunday, January 1, 2017 | 19680000000 | 2658000000 |
| Monday, January 1, 2018 | 19366000000 | 2986000000 |
| Tuesday, January 1, 2019 | 18724000000 | 2195000000 |
| Wednesday, January 1, 2020 | 20561000000 | 2074000000 |
| Friday, January 1, 2021 | 18745000000 | 2339000000 |
| Saturday, January 1, 2022 | 17483000000 | 2570000000 |
| Sunday, January 1, 2023 | 17997000000 | 2483000000 |
| Monday, January 1, 2024 | 29536000000 | 2759000000 |
Unveiling the hidden dimensions of data
In the ever-evolving tech industry, understanding the financial strategies of giants like International Business Machines Corporation (IBM) and QUALCOMM Incorporated is crucial. Over the past decade, IBM's Selling, General, and Administrative (SG&A) expenses have shown significant fluctuations, peaking in 2024 with a 42% increase from 2023. This suggests a strategic shift or investment in operations. In contrast, Qualcomm's SG&A expenses have remained relatively stable, with a modest 20% increase from 2014 to 2024, indicating a consistent approach to managing operational costs.
From 2014 to 2023, IBM's expenses averaged around 21 billion annually, while Qualcomm maintained an average of approximately 2.5 billion. This stark difference highlights IBM's larger scale and possibly more complex operational structure. As we move forward, these trends offer insights into each company's strategic priorities and market positioning.
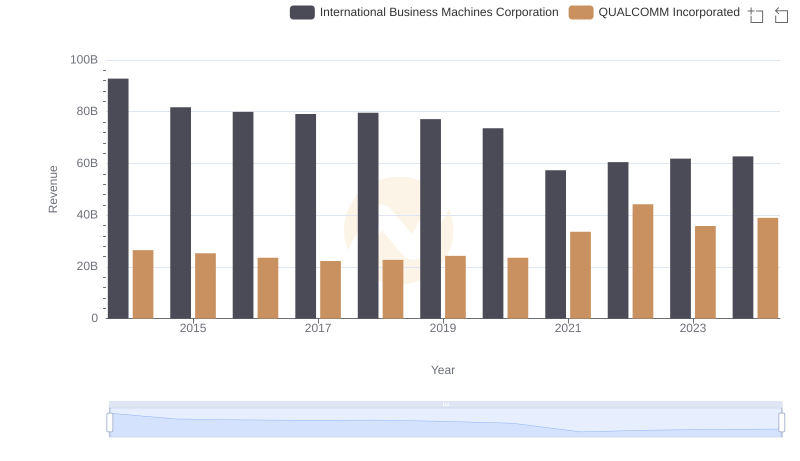
Comparing Revenue Performance: International Business Machines Corporation or QUALCOMM Incorporated?
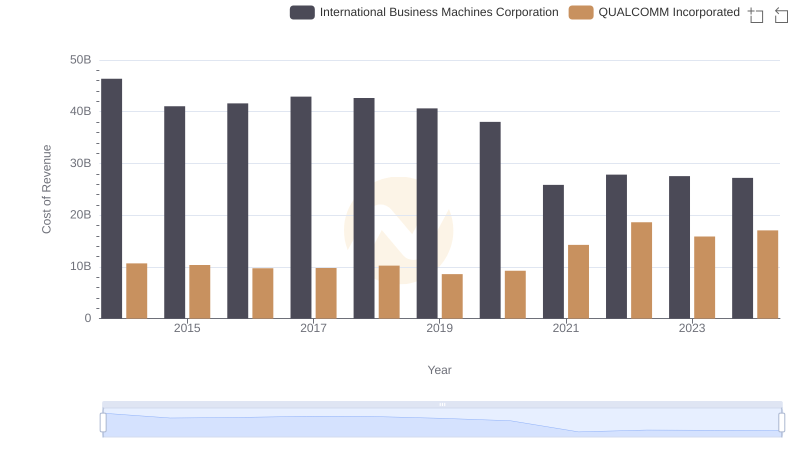
Cost of Revenue Comparison: International Business Machines Corporation vs QUALCOMM Incorporated
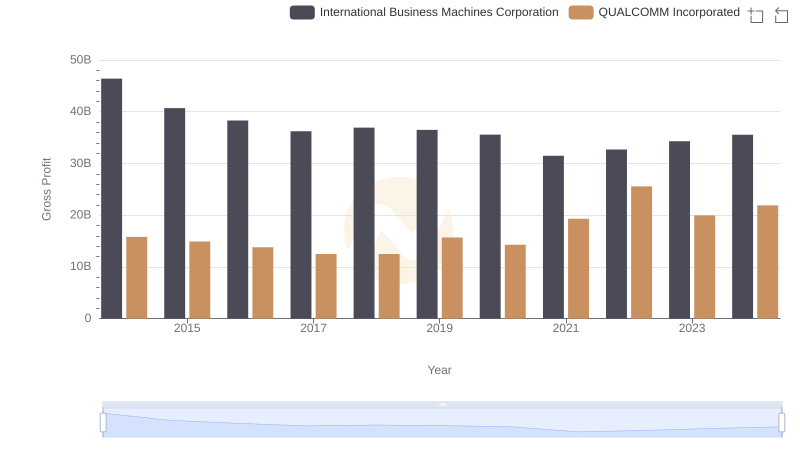
Gross Profit Trends Compared: International Business Machines Corporation vs QUALCOMM Incorporated
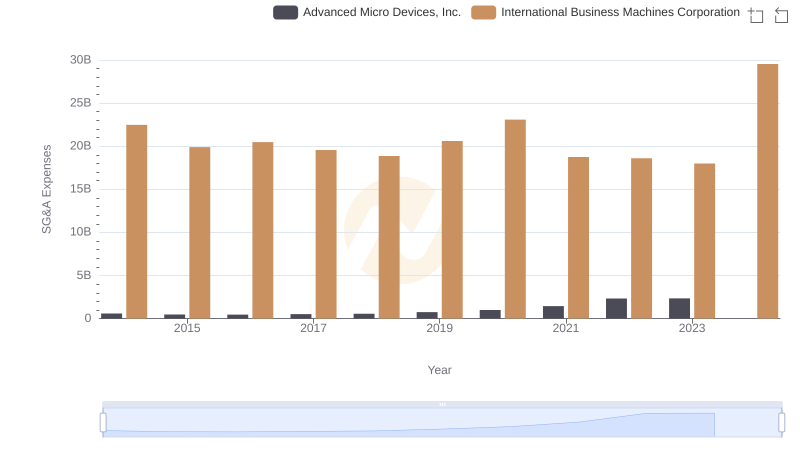
Operational Costs Compared: SG&A Analysis of International Business Machines Corporation and Advanced Micro Devices, Inc.
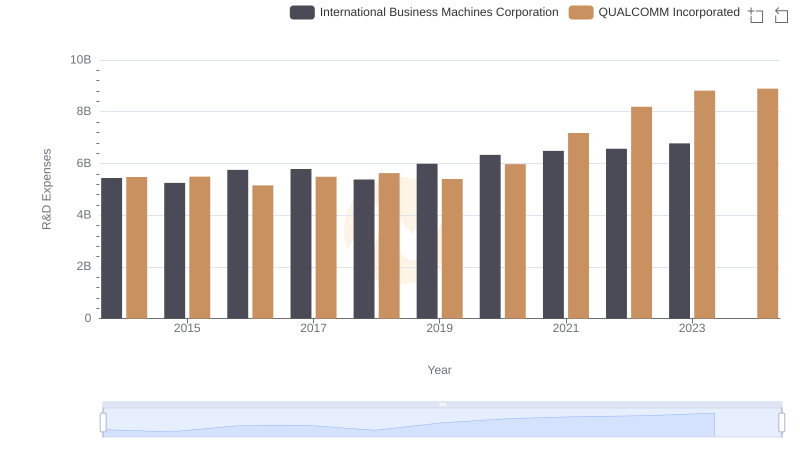
International Business Machines Corporation vs QUALCOMM Incorporated: Strategic Focus on R&D Spending
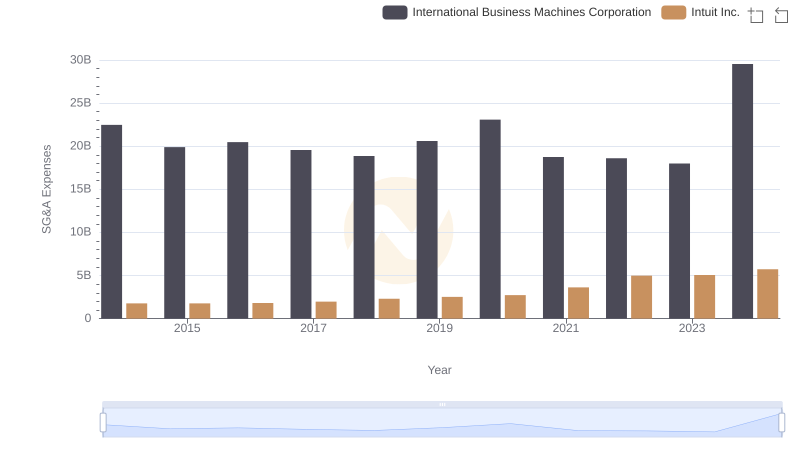
International Business Machines Corporation or Intuit Inc.: Who Manages SG&A Costs Better?
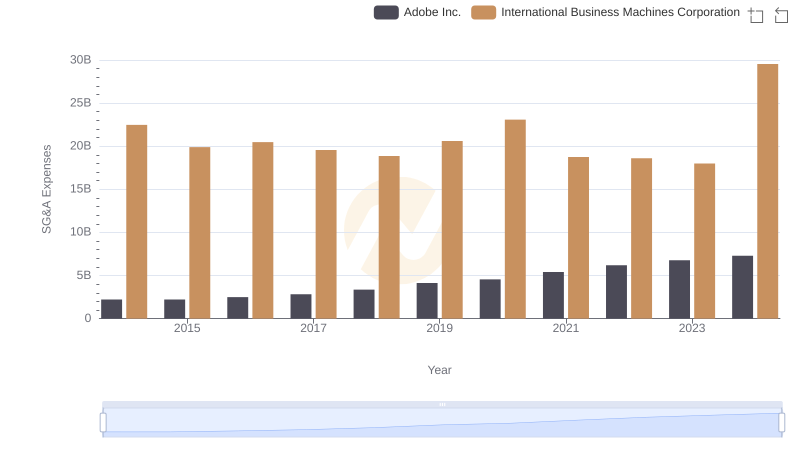
Comparing SG&A Expenses: International Business Machines Corporation vs Adobe Inc. Trends and Insights
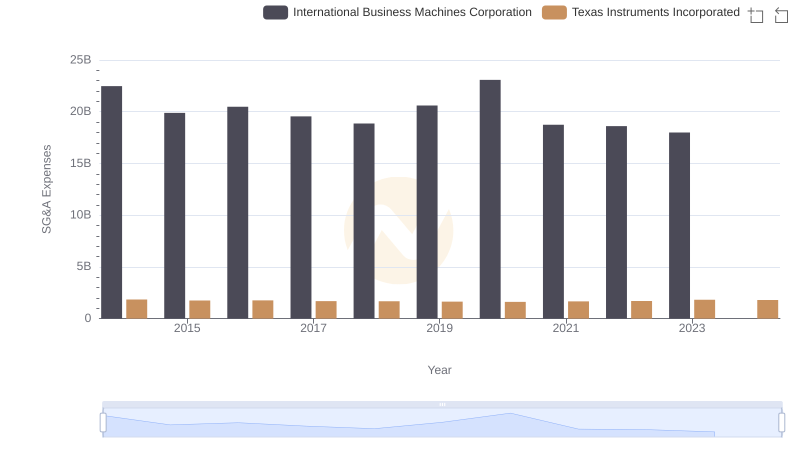
International Business Machines Corporation or Texas Instruments Incorporated: Who Manages SG&A Costs Better?
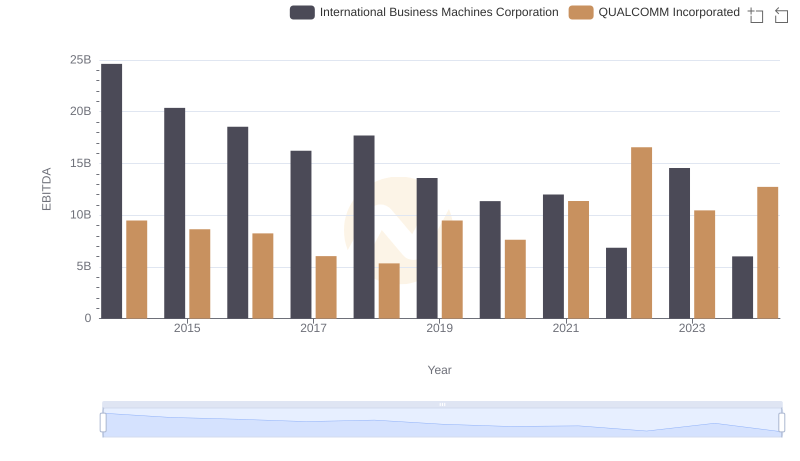
Professional EBITDA Benchmarking: International Business Machines Corporation vs QUALCOMM Incorporated
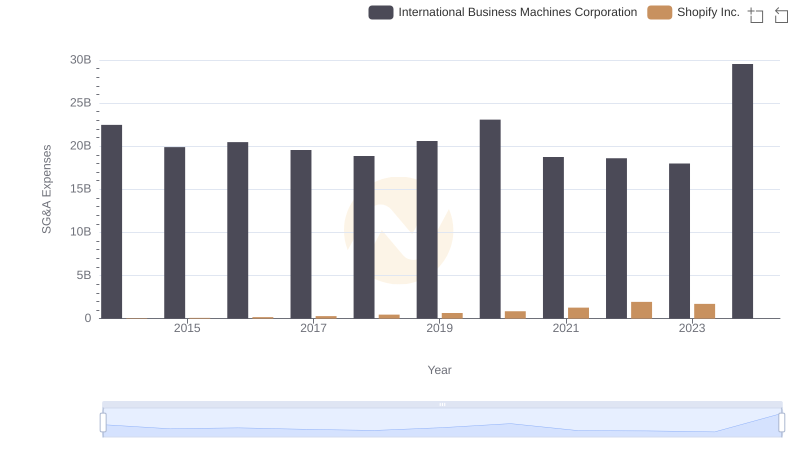
International Business Machines Corporation vs Shopify Inc.: SG&A Expense Trends
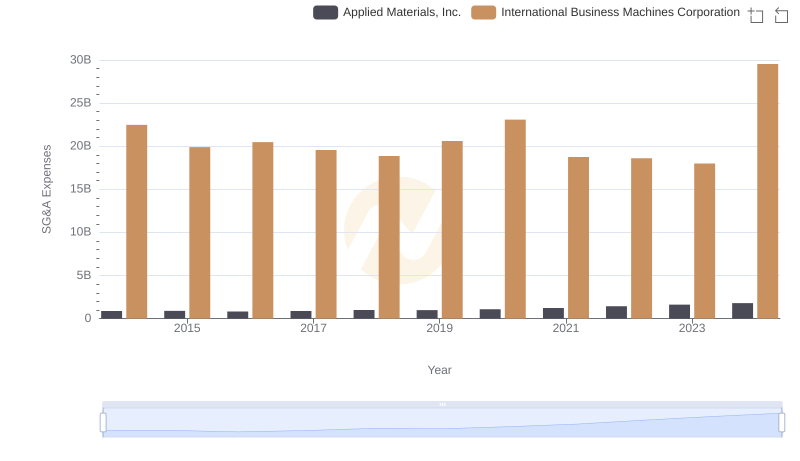
SG&A Efficiency Analysis: Comparing International Business Machines Corporation and Applied Materials, Inc.
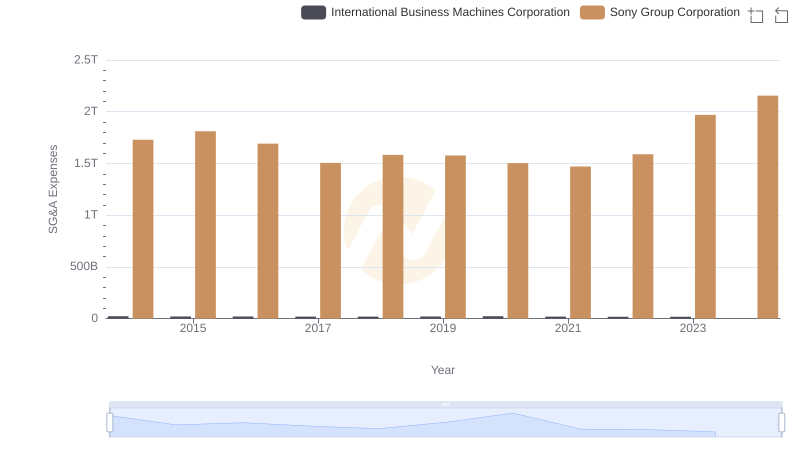
Who Optimizes SG&A Costs Better? International Business Machines Corporation or Sony Group Corporation